The Gensler Research Institute partnered with the MIT Mobility Initiative to investigate how organizations can cut their emissions during the workday. This study quantifies the trade-offs between various forms of urban mobility (gas-powered cars, electric vehicles, public transportation, biking, and walking) and looks at the diverse carbon profiles of the homes and workspaces we occupy during the day.

Where we work and how we get to our workplaces play a significant role in shaping carbon emissions — and those factors are shaped by individuals, organizations, and governments. Ultimately, the challenge will be solved at the intersection of behavior, design, and policy, through steps that decarbonize workplaces, reduce energy use in homes and offices, and de-emphasize the role of cars in our commutes.
To minimize the collective carbon impact of the commute, more commuters must drive electric cars, take public transit, or bike or walk to work.
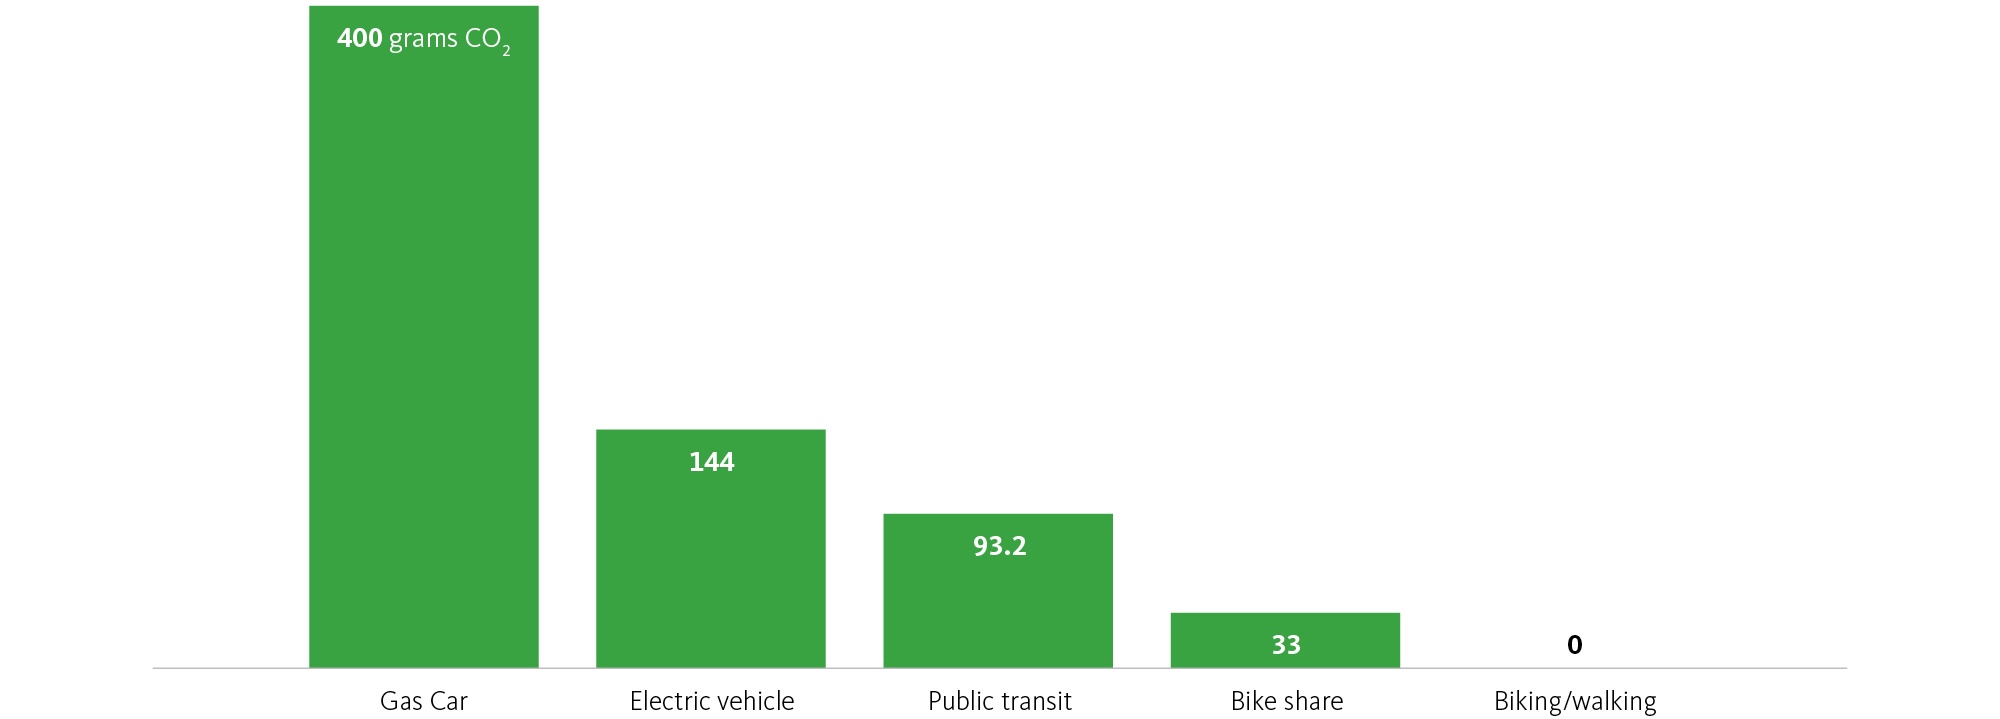
For individuals, the hierarchy of commuting choices is clear: gas-powered cars emit the most carbon; electric vehicles reduce emissions, especially in cities with cleaner energy grids; public transportation produces significantly less carbon than driving; and micromobility options, like walking or biking, have a negligible impact.
Organizations can reduce their collective carbon footprints by strategically addressing the commuting patterns of employees. This can include:
- Locating offices near public transit nodes.
- Providing shuttles to and from transportation hubs to avoid single point driving trips.
- Offering employees incentives, pre-tax benefits, or free rides for local public transit and micromobility systems.
Gas-powered cars produce more carbon emissions than any other commute mode.
Average carbon emissions per mile in the United States (grams CO₂e).
Shared workspaces are more efficient than private workspaces.
When considering what spaces we occupy and how we get to those spaces, the most carbon-efficient choices rely on shared or public infrastructure.
Organizations can play an important role by designing smaller and more efficient office spaces that reduce the square footage used per employee — allowing less space to be heated or cooled each day and lowering per-person carbon emissions.
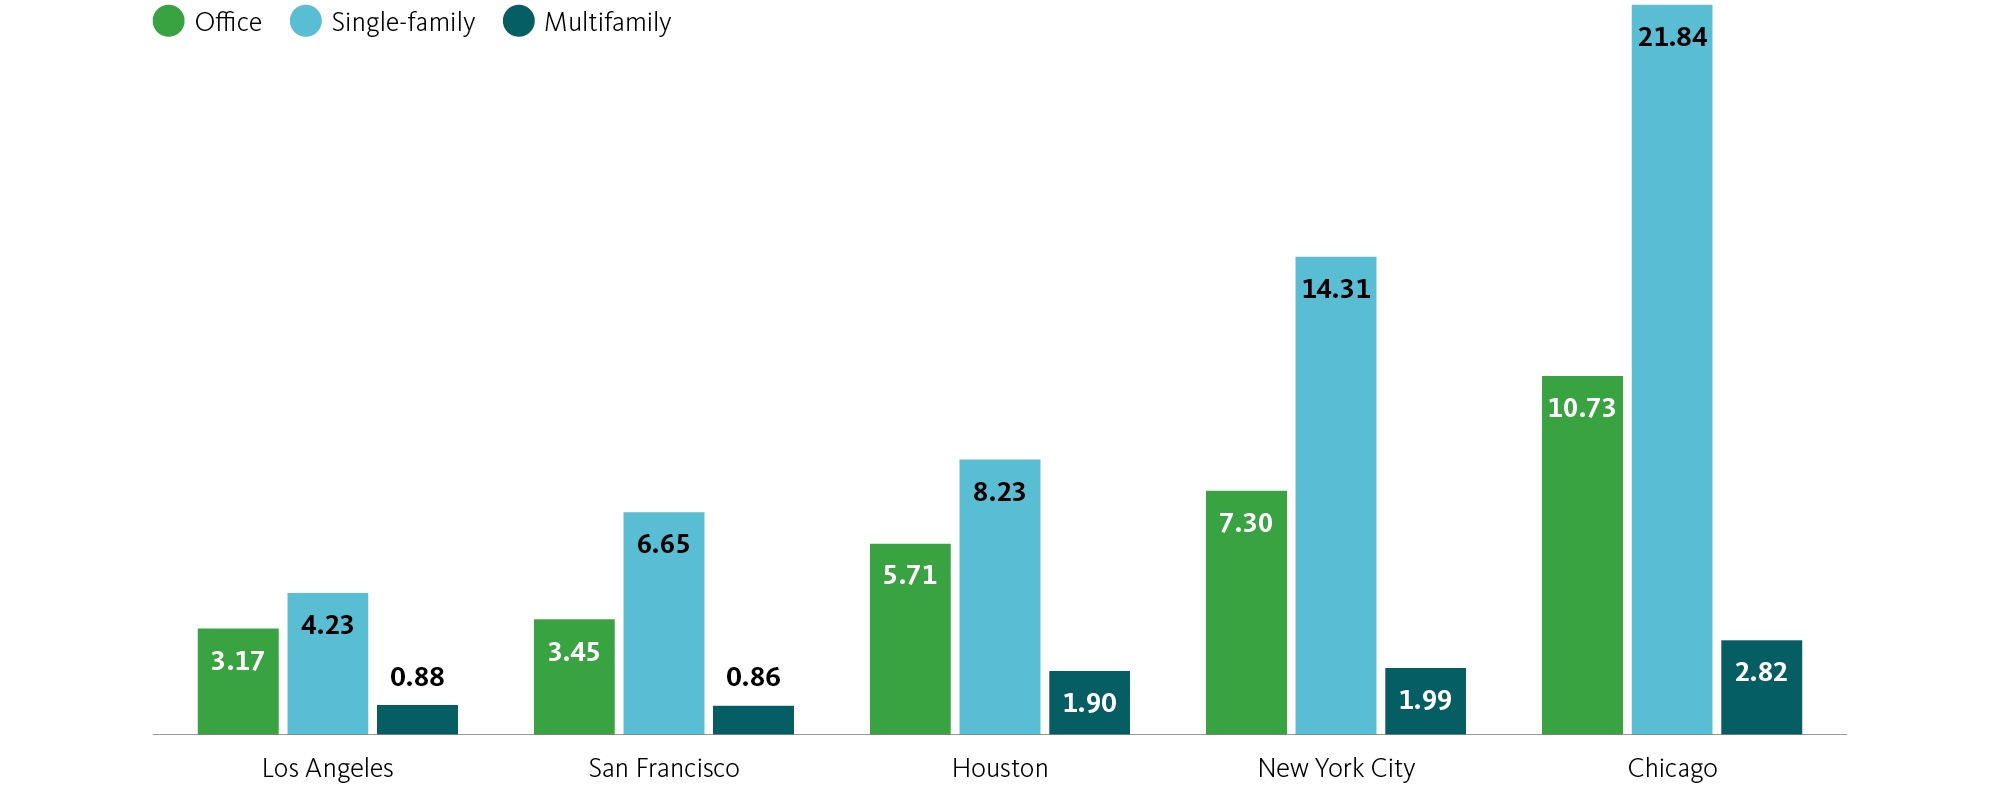
Carbon impact varies dramatically from city to city, too. Cities in temperate climates (e.g., Los Angeles) require less heat and air-conditioning, and cities that rely on fossil fuels for energy (e.g., Chicago) contribute more to carbon emissions.
For people who can choose where to work, a primary way to cut carbon impact is to spend more time in collective spaces while cutting energy use in unoccupied homes. This is most effective when balanced with reductions in commute emissions by switching away from gas-powered cars. A complete analysis of tradeoffs for each city, commute mode, and housing type is provided in the text of the report.
Carbon emissions vary by space type and location.
Shown in metric tonnes of CO₂e/person/year. Standard of one occupant for every 150 square feet in offices, 650 square feet in multifamily homes, and 1,000 square feet in single-family homes.
Discover the carbon impact of your workday.
If you live in one of the nine urban areas included in this study, you can answer a few simple questions to determine your own carbon impact using Gensler and MIT’s interactive tool: Enter your city, your commute distance, mode of transportation, and a few other factors — you can even explore scenarios like moving closer to the office, driving an electric car, or taking public transit.

The Carbon Impact of a Workday Methodology
This study combines building emissions (office and home) with commute emissions to calculate the full carbon impact of a workday. Data analysis was conducted jointly by MIT and the Gensler Research Institute using both proprietary and publicly available data. Total carbon impact was assessed for Chicago, Houston, Los Angeles, New York, and San Francisco, with additional commute data gathered for Boston, Denver, Miami, and Phoenix. Building emissions account for climate zone, local energy grid composition, regional building codes, occupancy per square foot by building type, and the potential for energy savings through behavioral change. Commute emissions reflect each city’s average commute distance, mode distribution, and grid composition for electric vehicles.
Download Gensler and MIT’s joint research report — The Carbon Impact of a Workday — to learn how individuals, designers, organizations, and governments can take action to reduce the carbon emissions of traditional office work.