What We’ve Learned in Three Years Studying Higher Education
December 22, 2023 | By Erin Cubbison, Kristen Tobing Stromsvold, and Allison Bonser
Editor’s note: This is the first blog in this series. To learn more about the 2023 Education Engagement Index survey, please see part two.
Hybrid learning appears to be here to stay. Yet, as more students return to college and university campuses, our latest Education Engagement Index survey shows that hybrid and virtual learning are suffering. So, what does it mean for the future of higher education?
In 2021, when we launched the first Education Engagement Index survey, we studied the learning experience both during and pre-COVID to understand the impacts of learning from home and how it was shaping future expectations for the campus. In 2022, we conducted the second Education Engagement Index survey as people began to return to campus, with hybrid learning as a primary learning experience for many, and considered the findings as an indicator of what would become of learning environments and campuses of the future. In this third year of implementation, the 2023 Education Engagement Index survey allows us to track how learning effectiveness, experiences, and expectations continue to change each year as we move on from the COVID-19 pandemic and test new learning approaches.
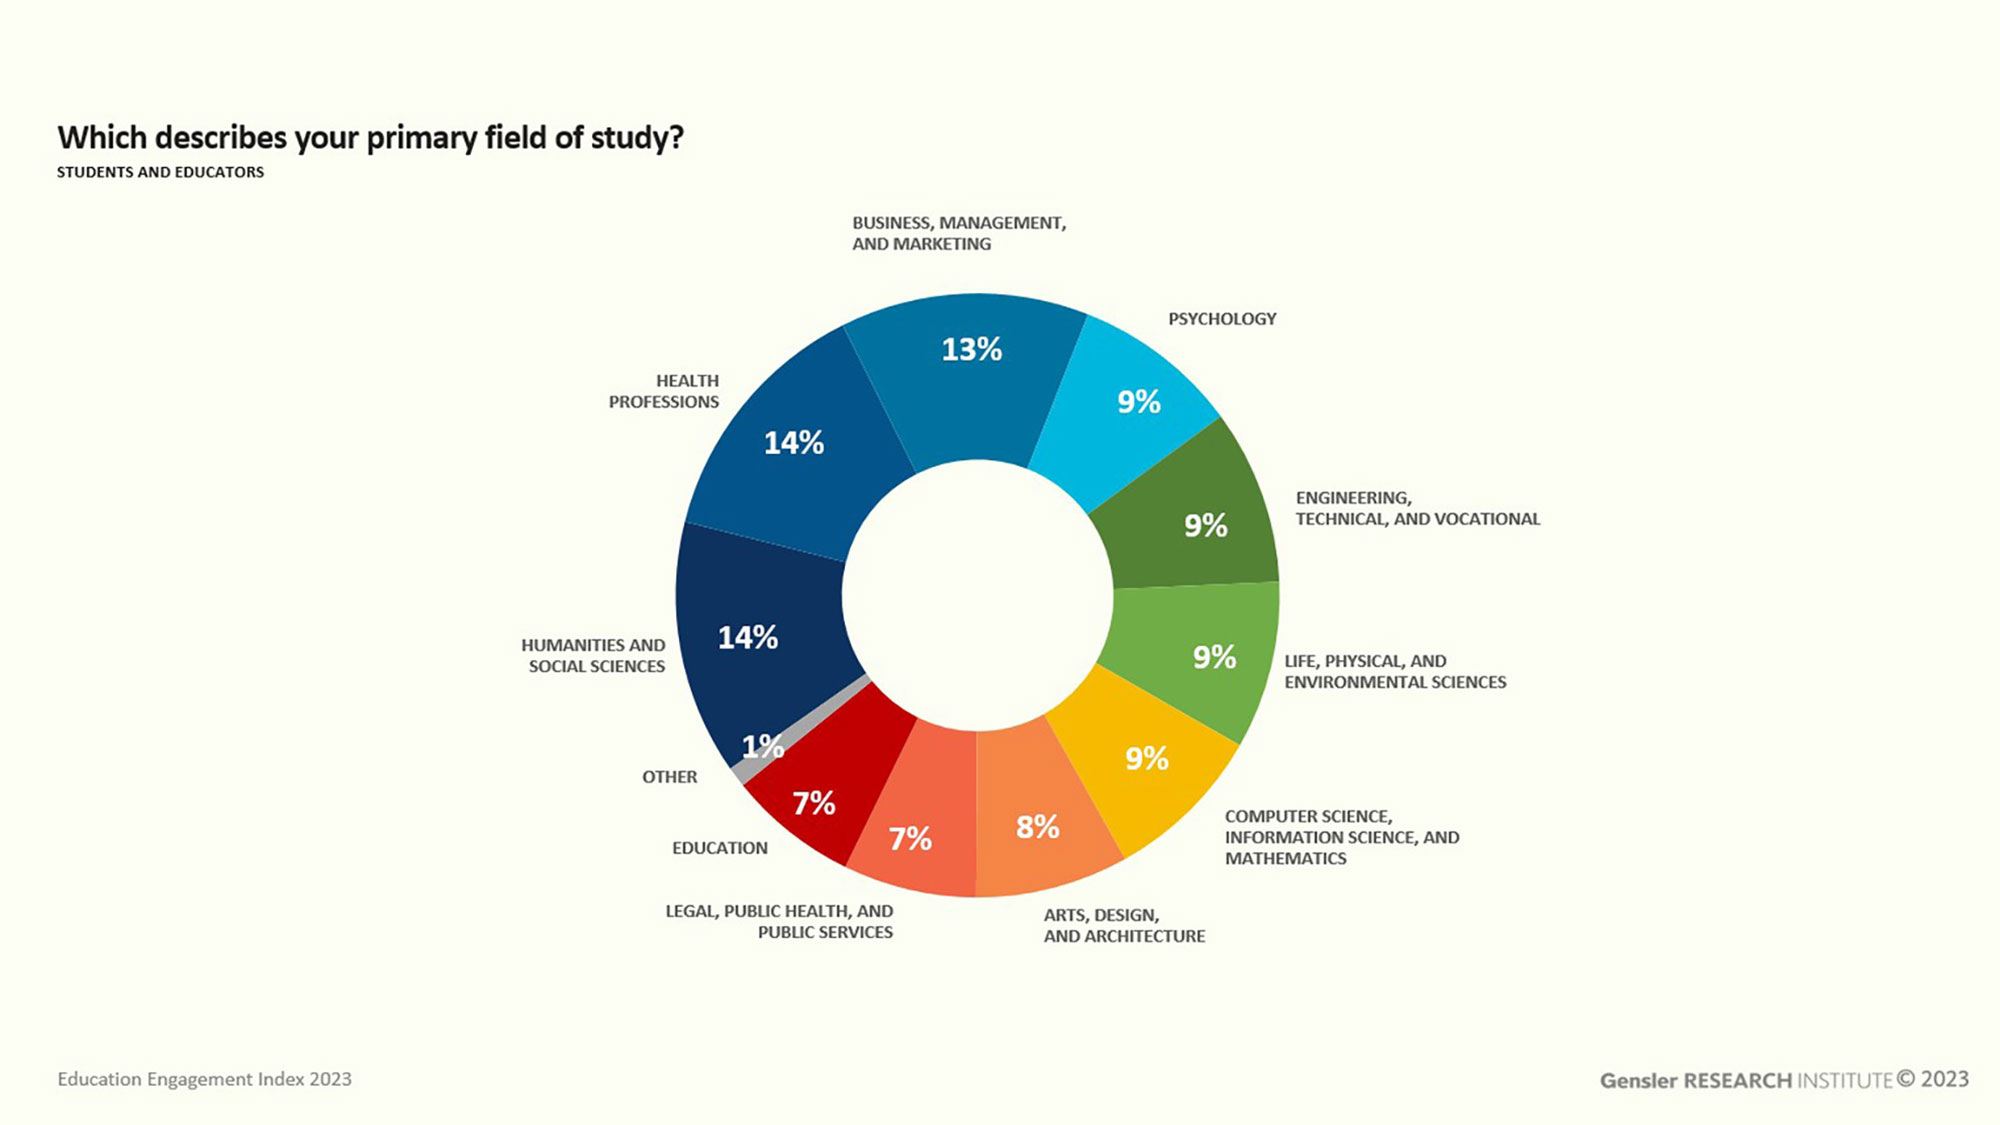
The 2023 survey data was collected from 2,500 U.S.-based college students, educators, and staff. The respondents represent public and private institutions, in both undergraduate and graduate degree programs, across various fields of study. Learn more about our survey method.
Here’s a look at some of the key findings from our 2023 Education Engagement Index survey:
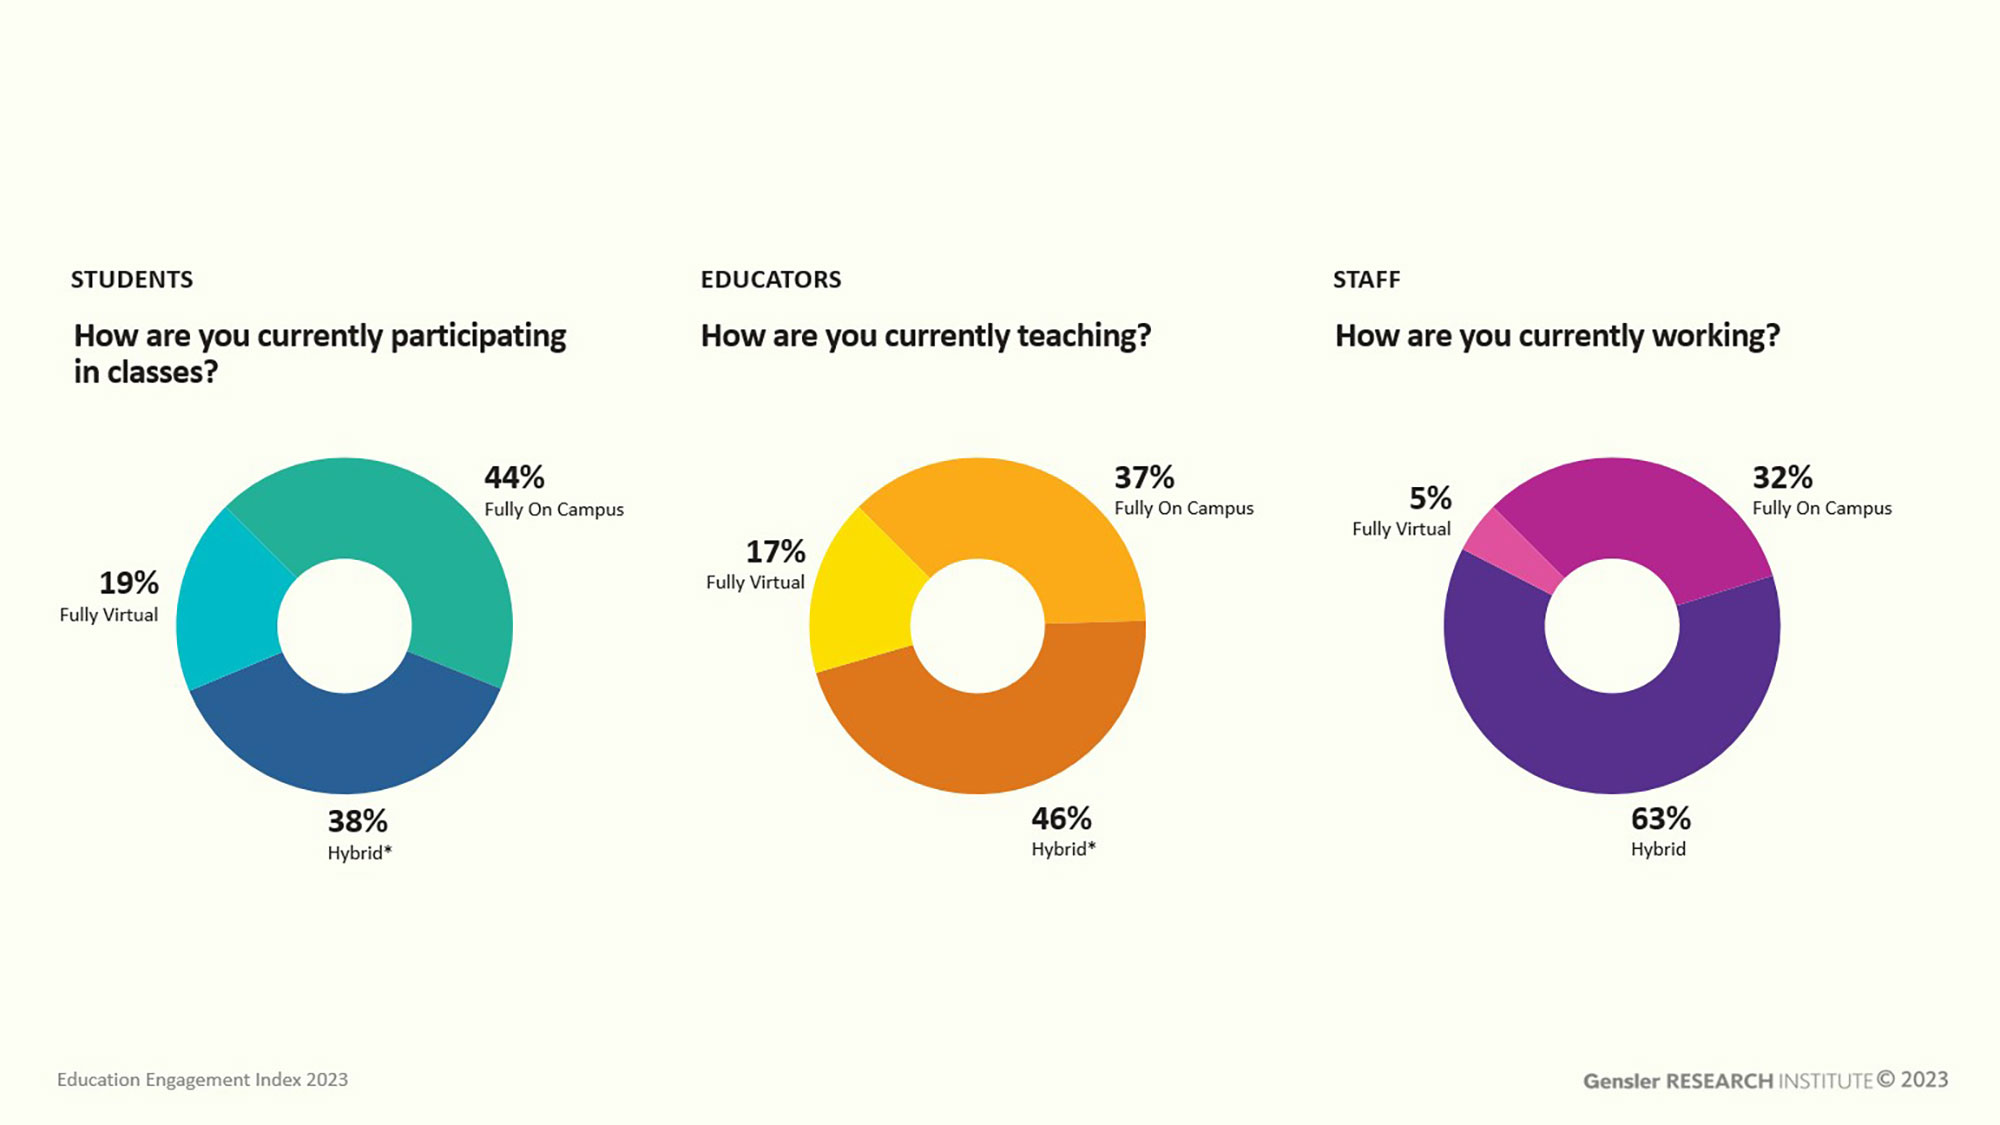
Campus presence is increasing for all groups.
There are now more students participating in their classes fully on campus than in the hybrid modality. Currently, 82% of students are participating in all or part of their classes on campus, which is up 10% from 2022. Likewise, most educators and staff are teaching and working on campus or in a hybrid manner.
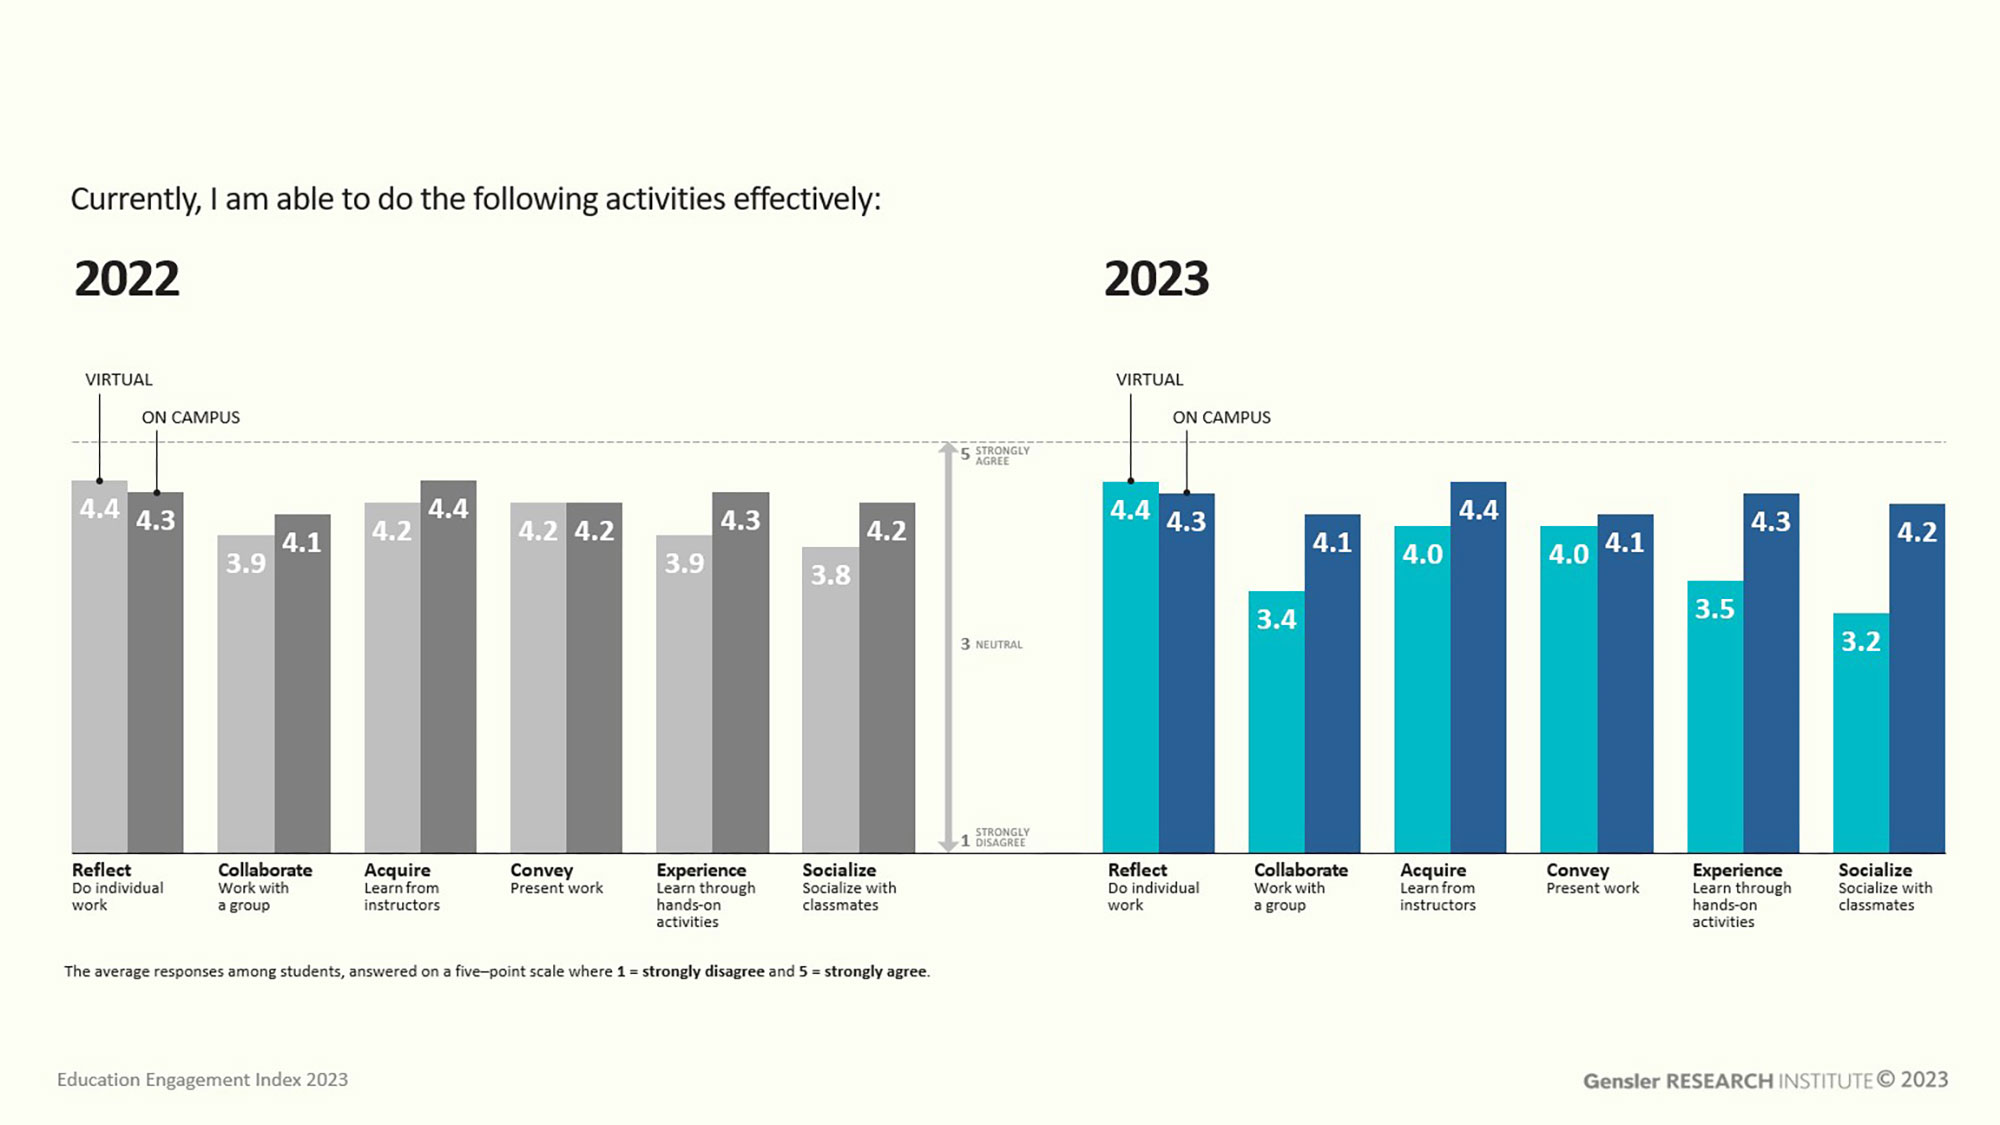
76% of students feel successful in most or all their classes. However, learning effectiveness has decreased from 2022. The majority of students feel successful in most or all their classes, more so than both during and before the pandemic. Since last year, however, they report that their sense of effectiveness has dipped across all learning modes, except for doing individual work (reflect). The largest decreases in effectiveness are reported in collaborating, learning through hands-on activities (experience), and socializing.
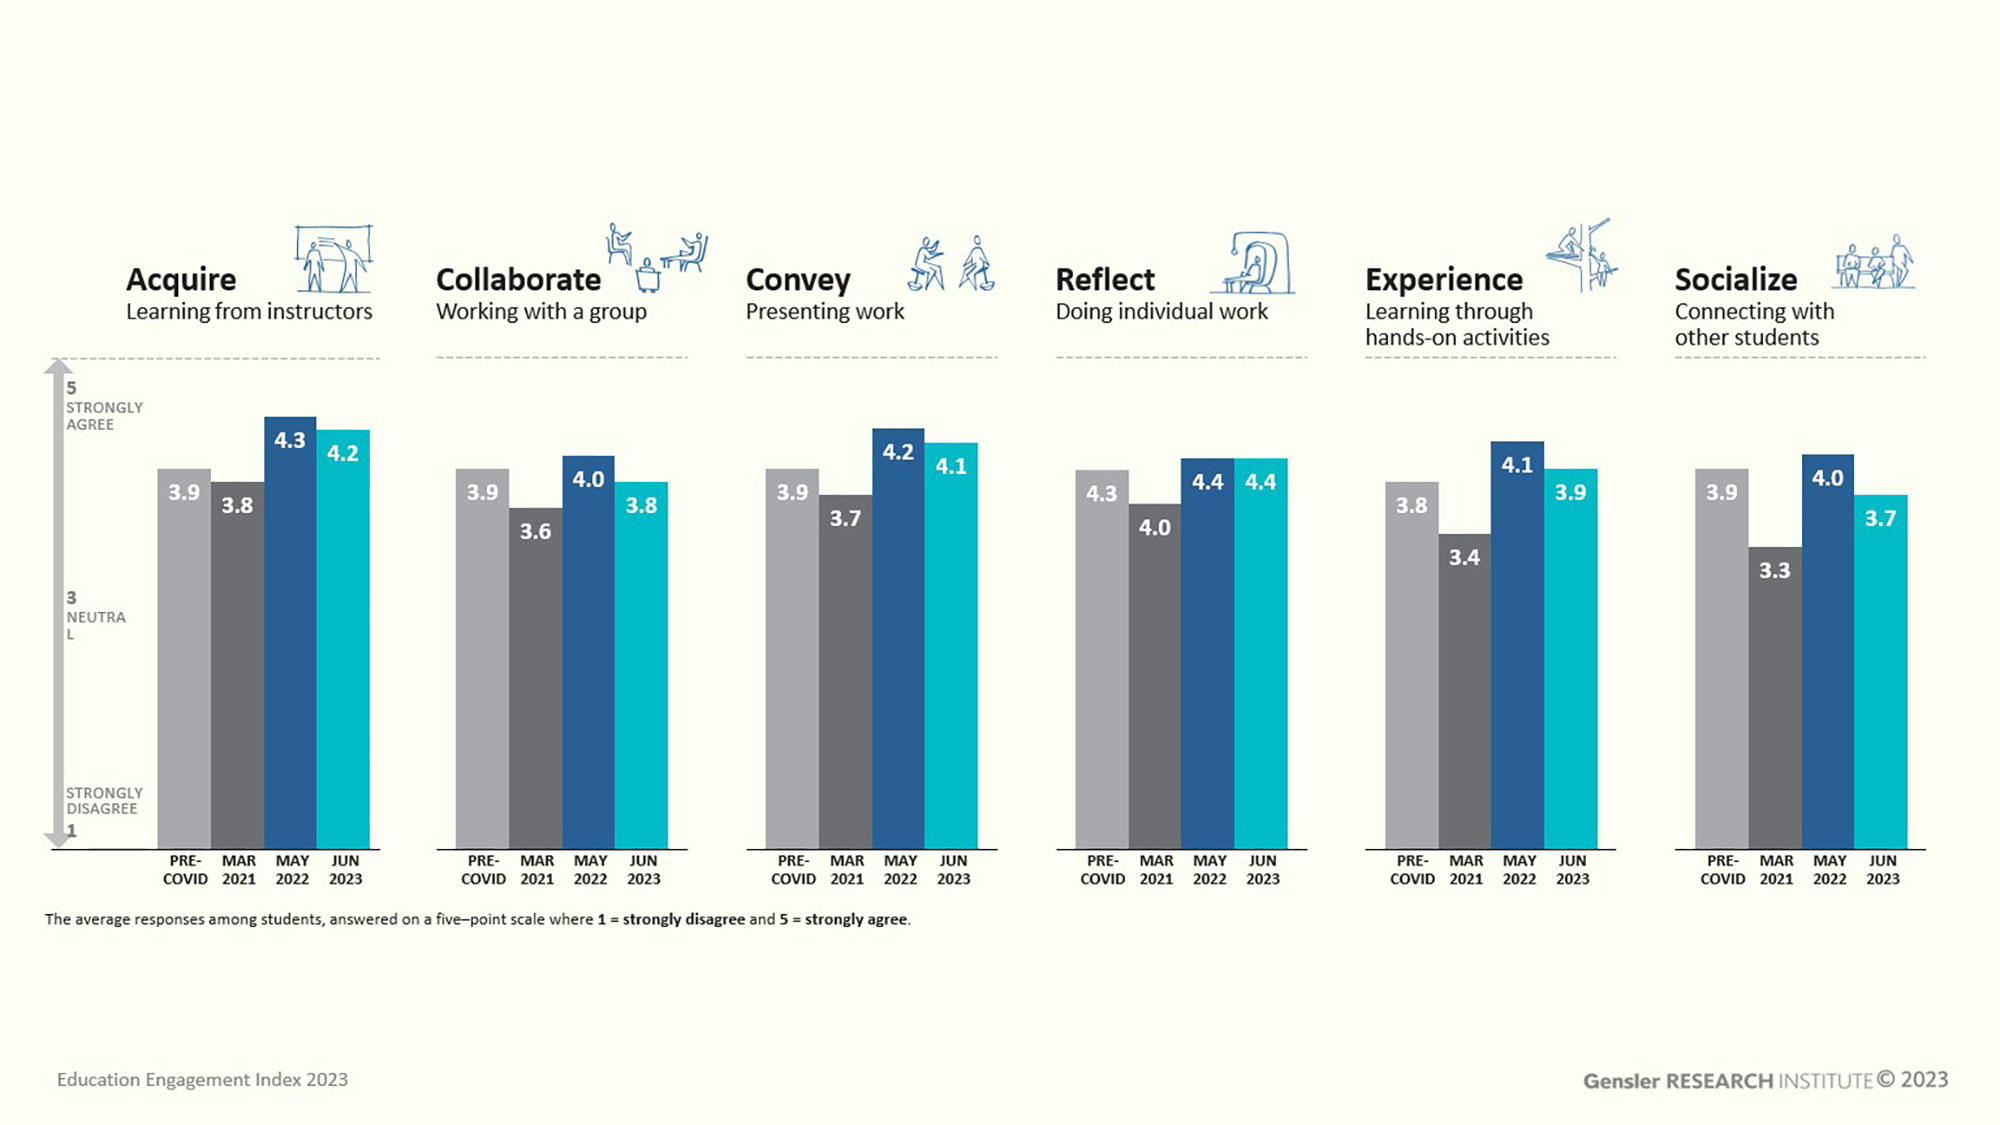
When we examine learning effectiveness by location, on-campus versus virtual, students are reporting lower effectiveness for virtual activities than last year, while on-campus effectiveness remains steady.
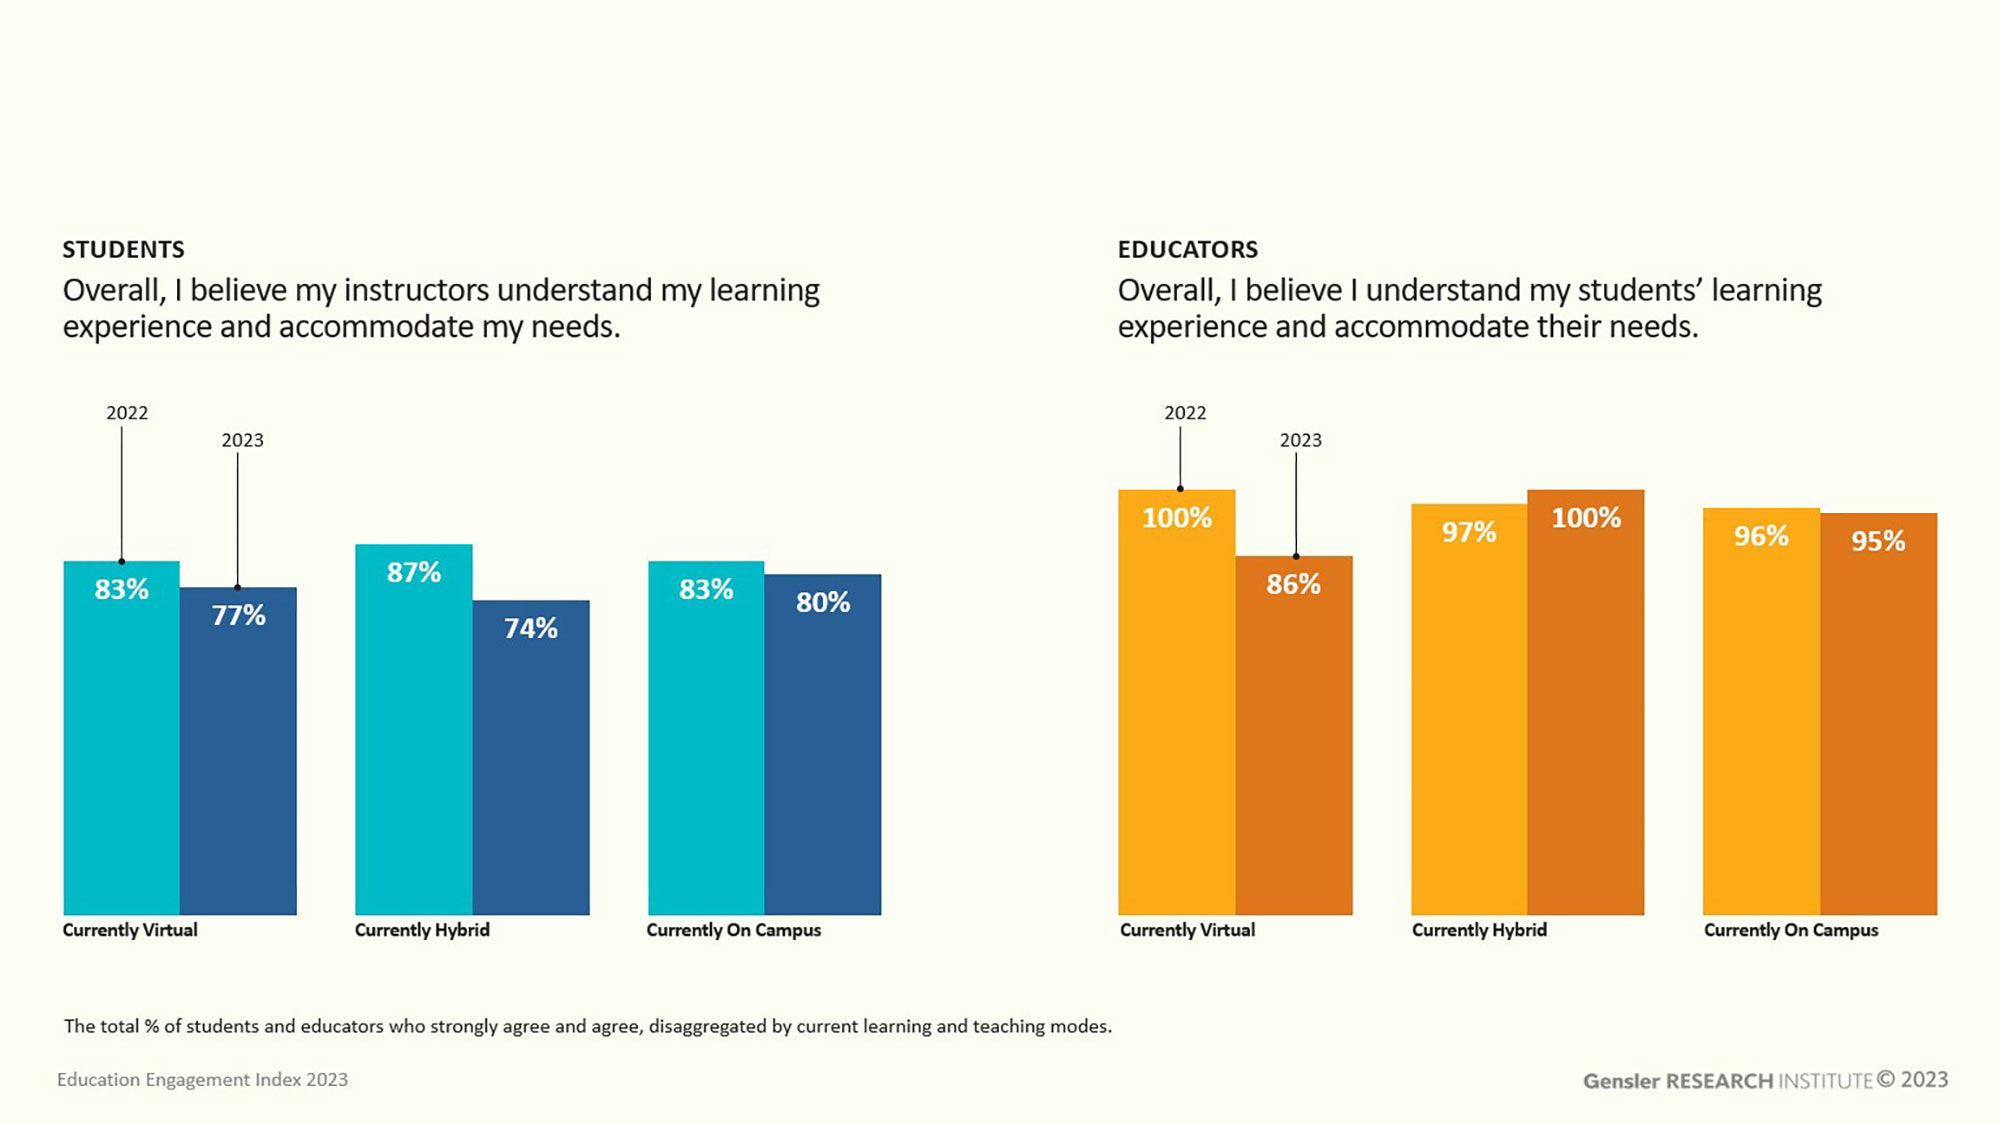
To better understand what aspects of a student’s learning experience may impact their effectiveness, we asked students and educators to rate how well educators understand a student’s experience and accommodate their needs. We found that a student’s or educator’s learning modality is a key indicator for how they answer this question.
There are three learning modalities for students and educators — on campus, virtual, and hybrid. We define hybrid as a combination of virtual and in-person interactions. Students and educators report a decrease from 2022 in understanding and accommodating students’ needs. Overall, educators feel they have a significant understanding of their students’ experiences and accommodate their needs; however, students feel less supported, especially hybrid students.
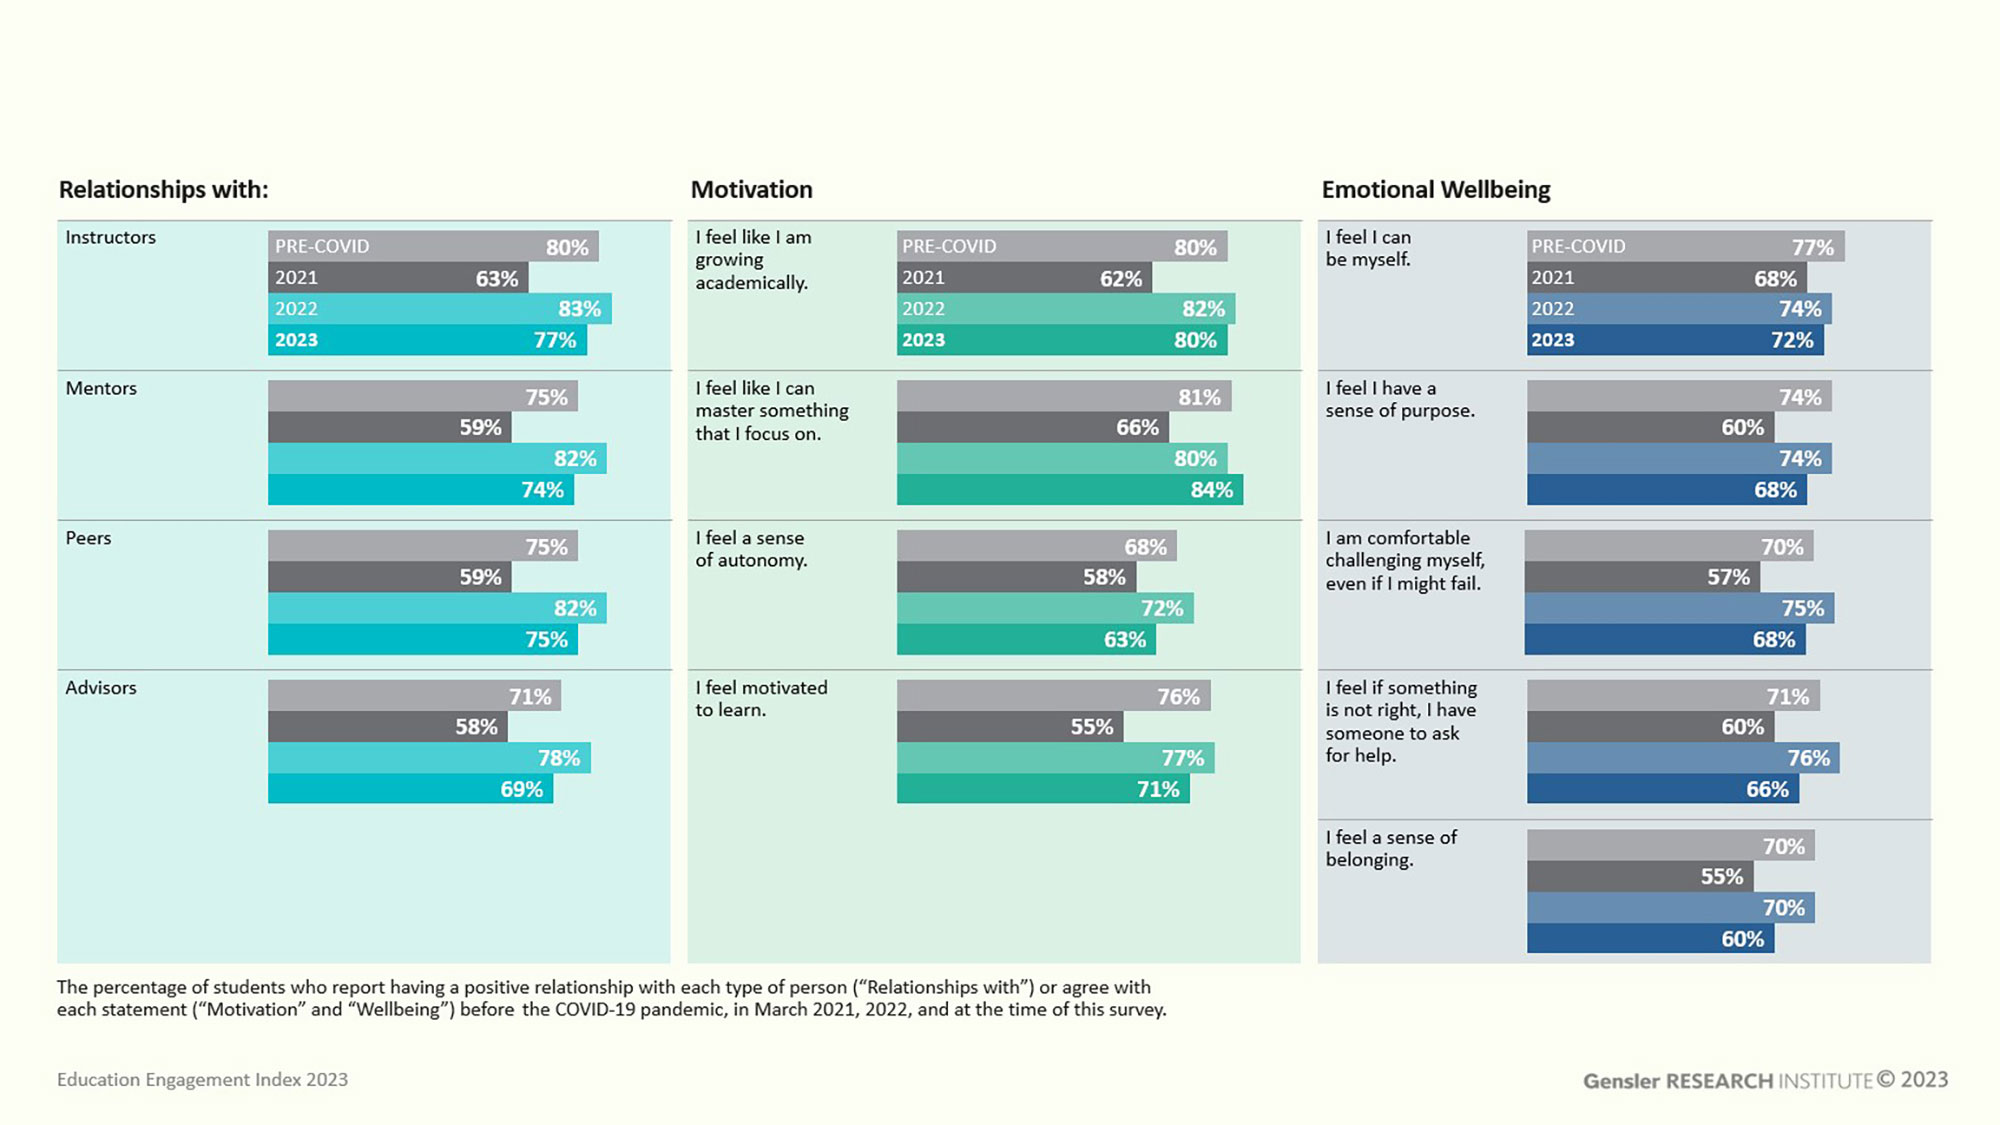
To understand engagement more deeply, we explored various dimensions of student relationships, motivation, and emotional well-being. We asked students about their relationships with instructors, mentors, peers, and advisors and in all cases, they report weaker relationships than last year, with some falling below pre-COVID levels. Similarly, on questions related to motivation and emotional well-being, there was a significant decline in nearly all questions, especially regarding sense of belonging.
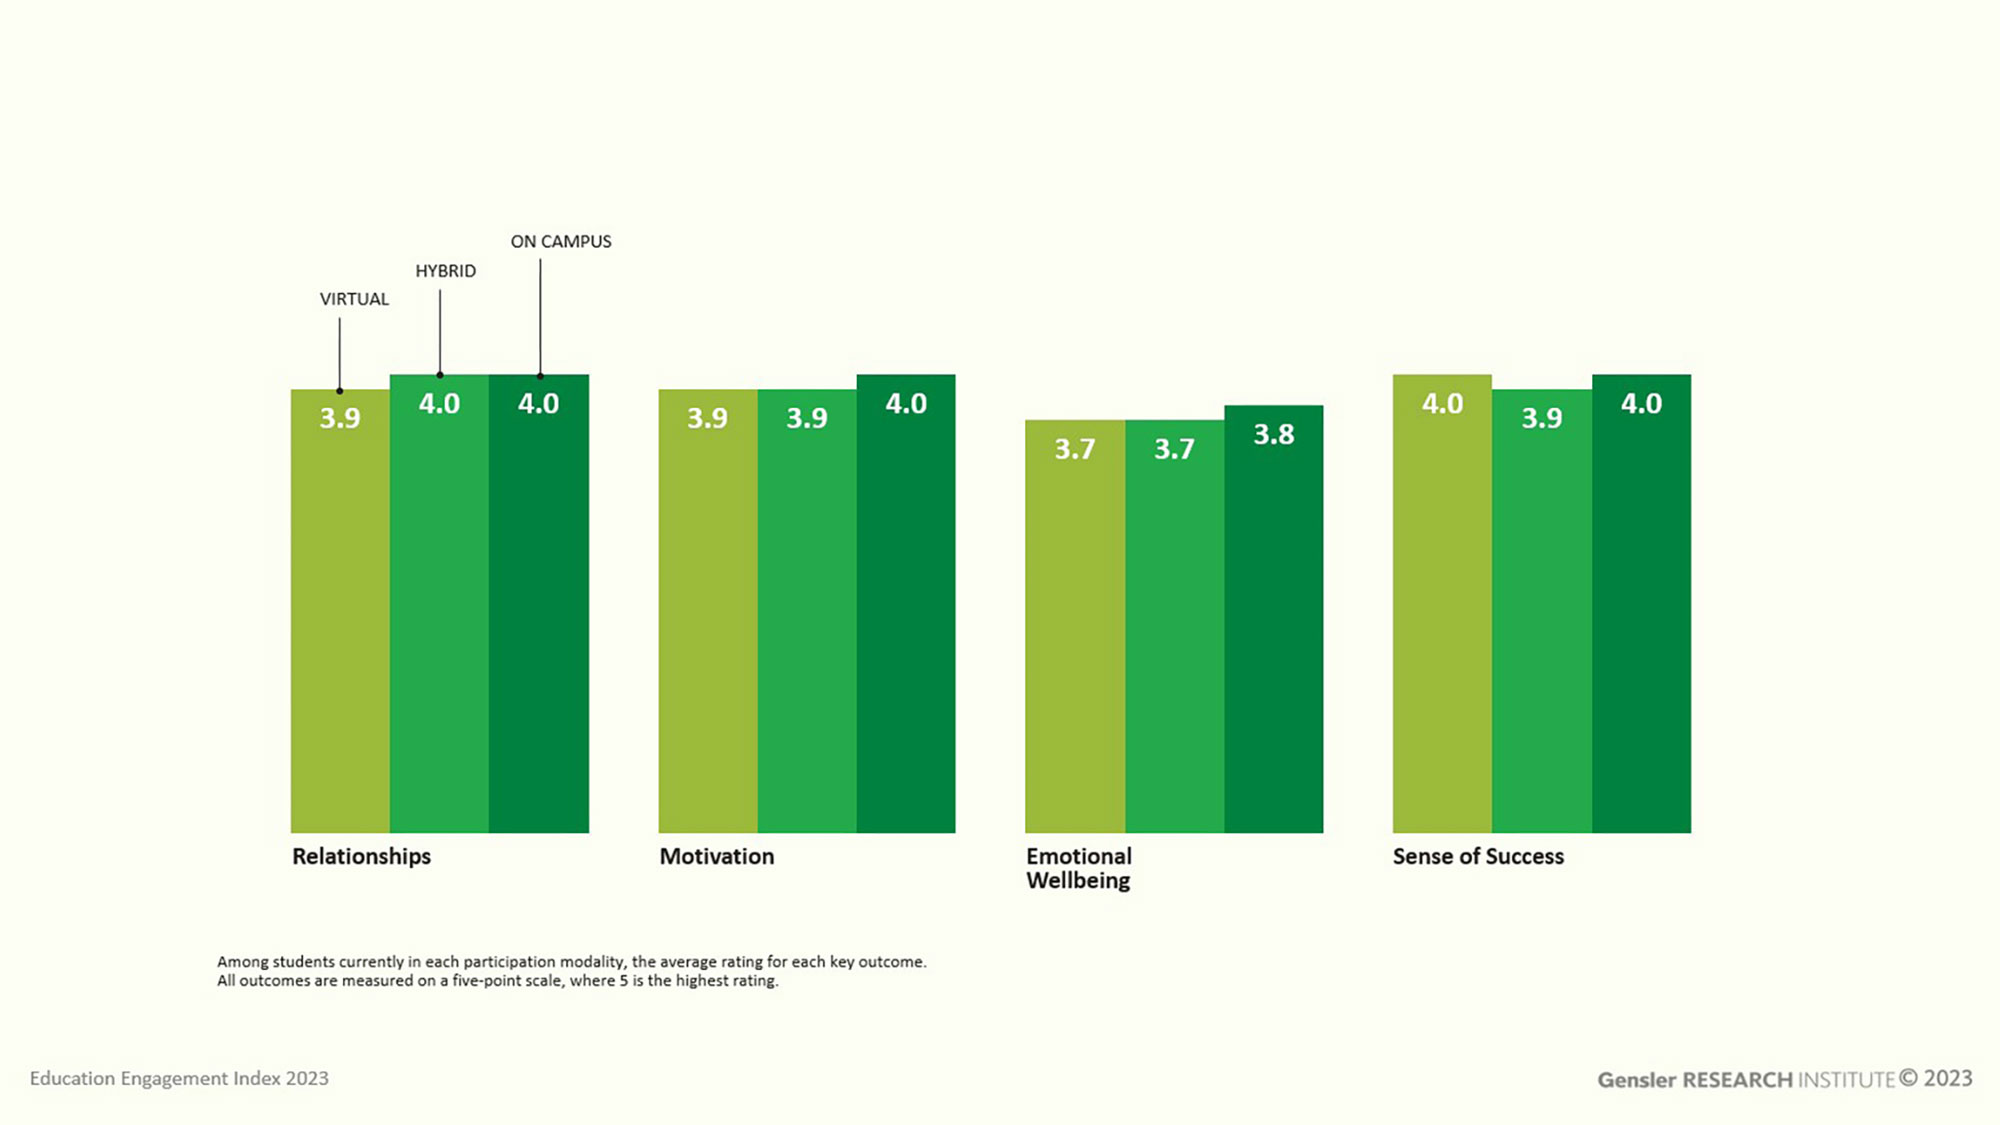
The responses do not appear to vary by modality. Students’ relationships, motivation, emotional well-being, and sense of success are consistent, whether they are virtual, hybrid, or on campus.
Like students, educators’ satisfaction, sense of success, and engagement levels have dipped since 2022. On the contrary, these metrics have risen for staff.
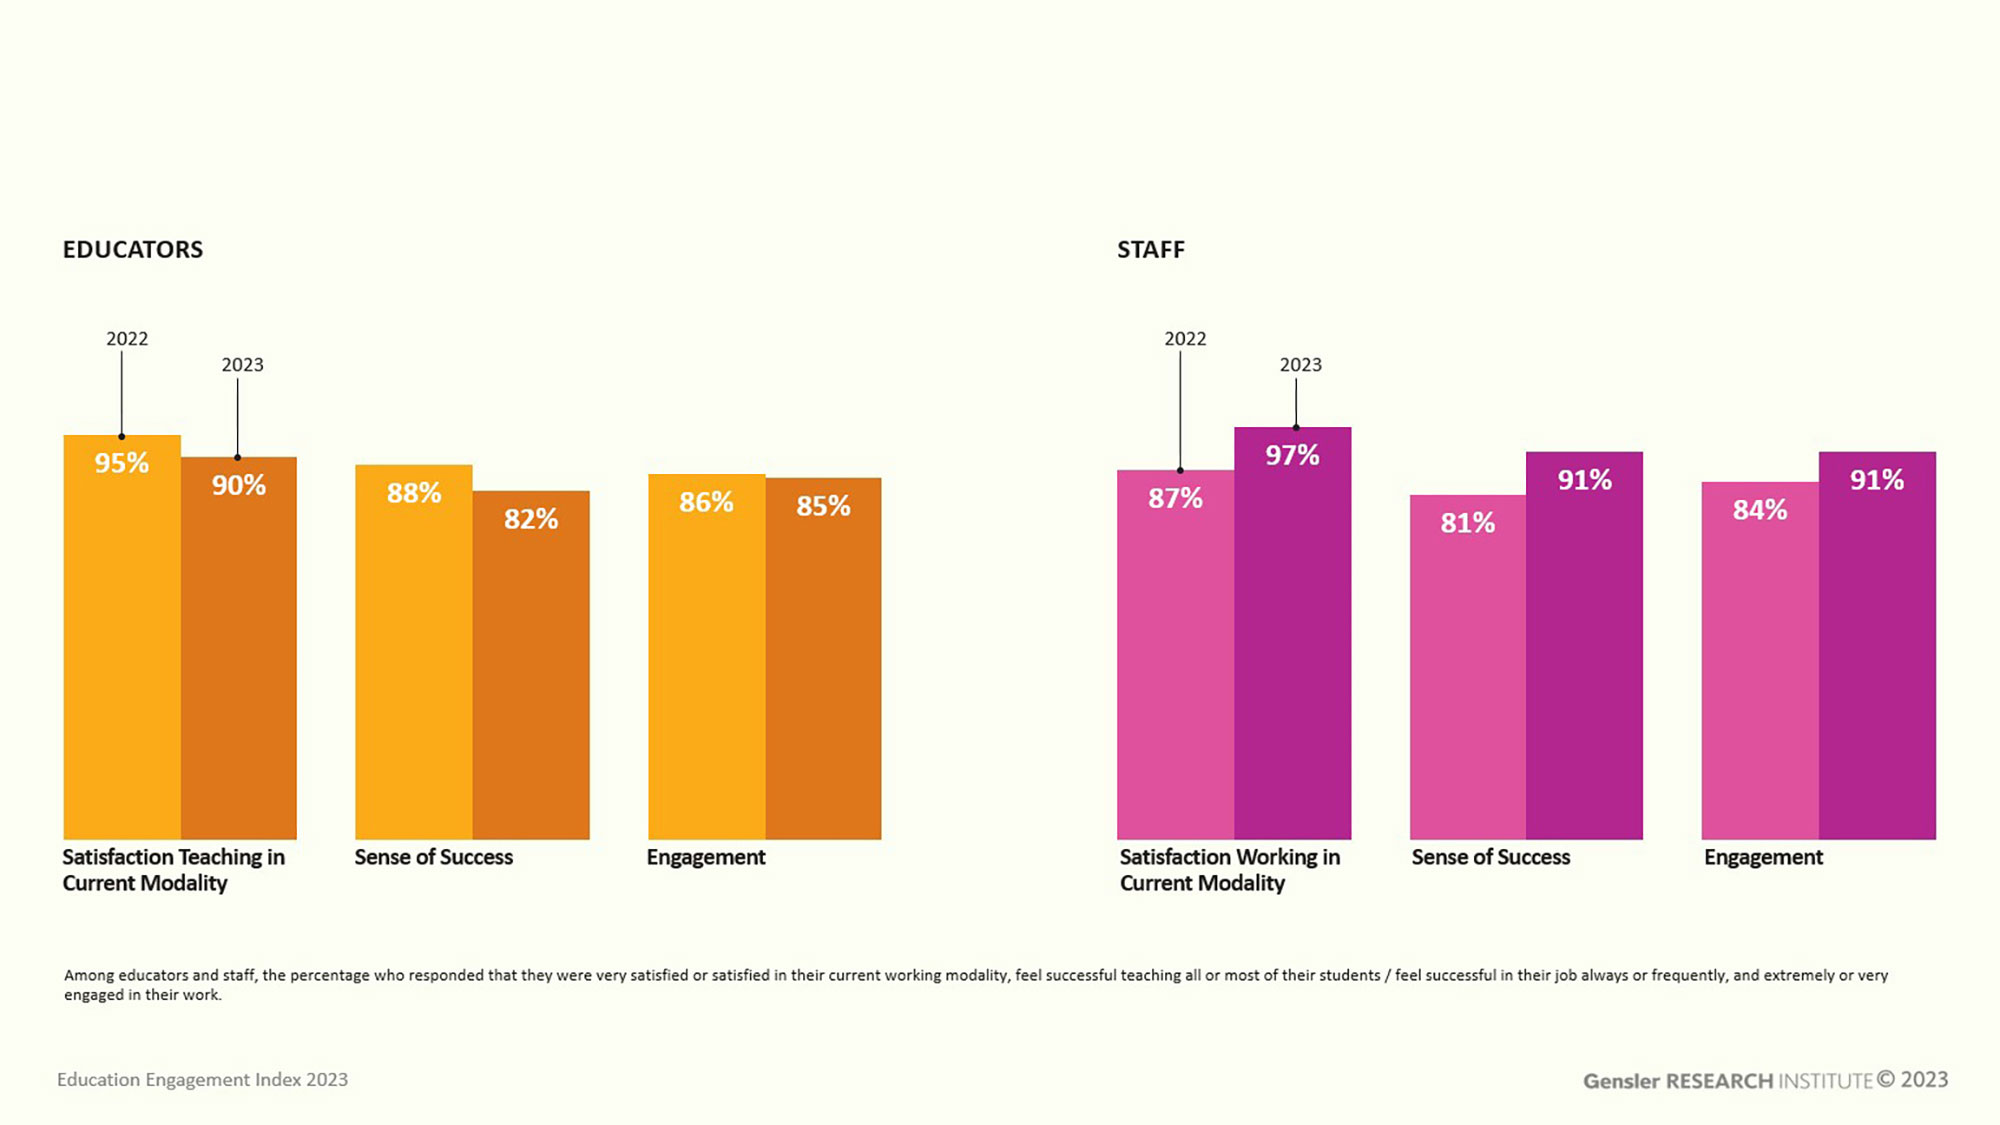
When we look at the on-campus experience, bringing people together is only part of the equation. Real effort around the topics of satisfaction, sense of success, and engagement — in both programming and policy — are important for a healthy campus community.
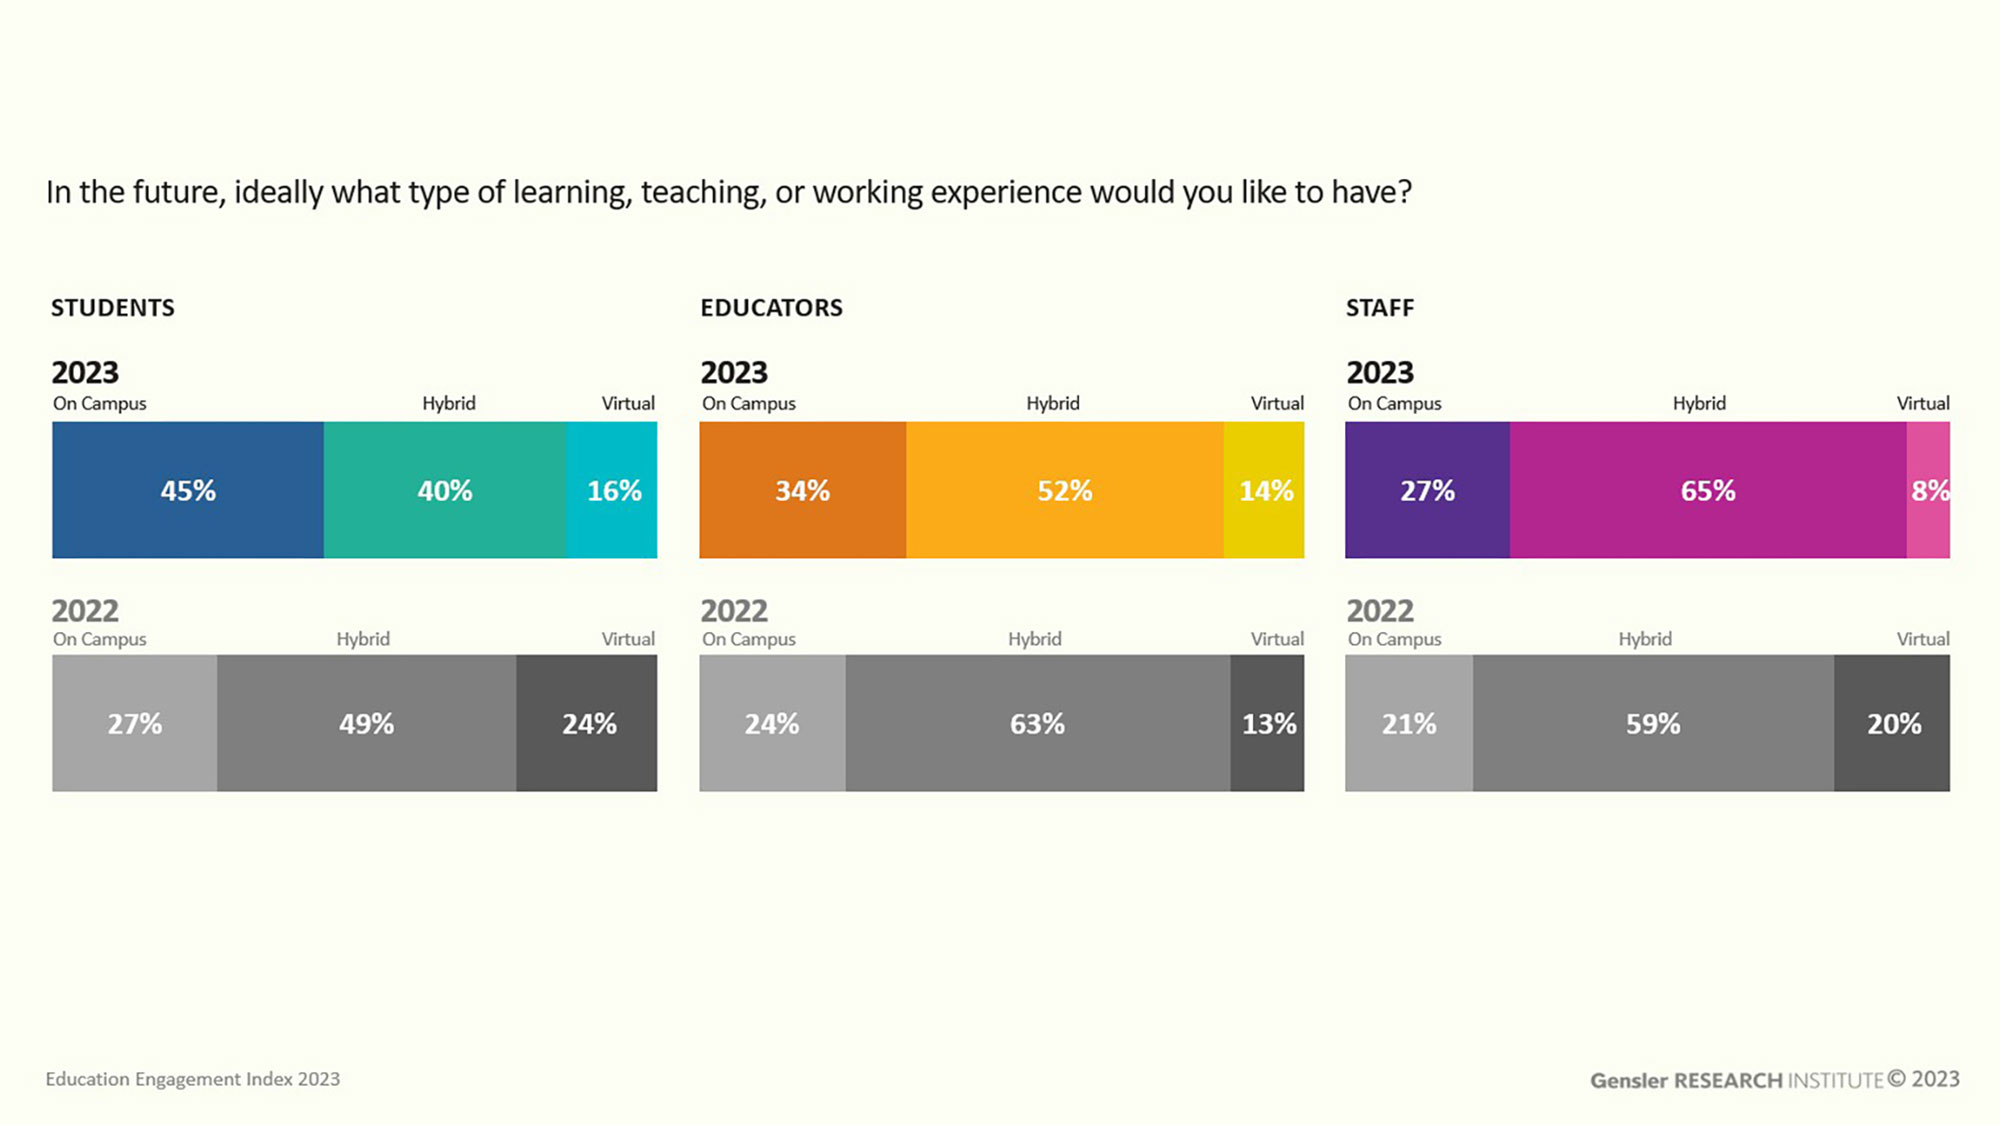
Students, educators, and staff all show an increased preference for an on-campus learning experience, while also maintaining strong preferences for hybrid.Students have the strongest preference for a fully on-campus learning experience with GenZ students being 2x more likely to prefer on-campus instruction than other generations.
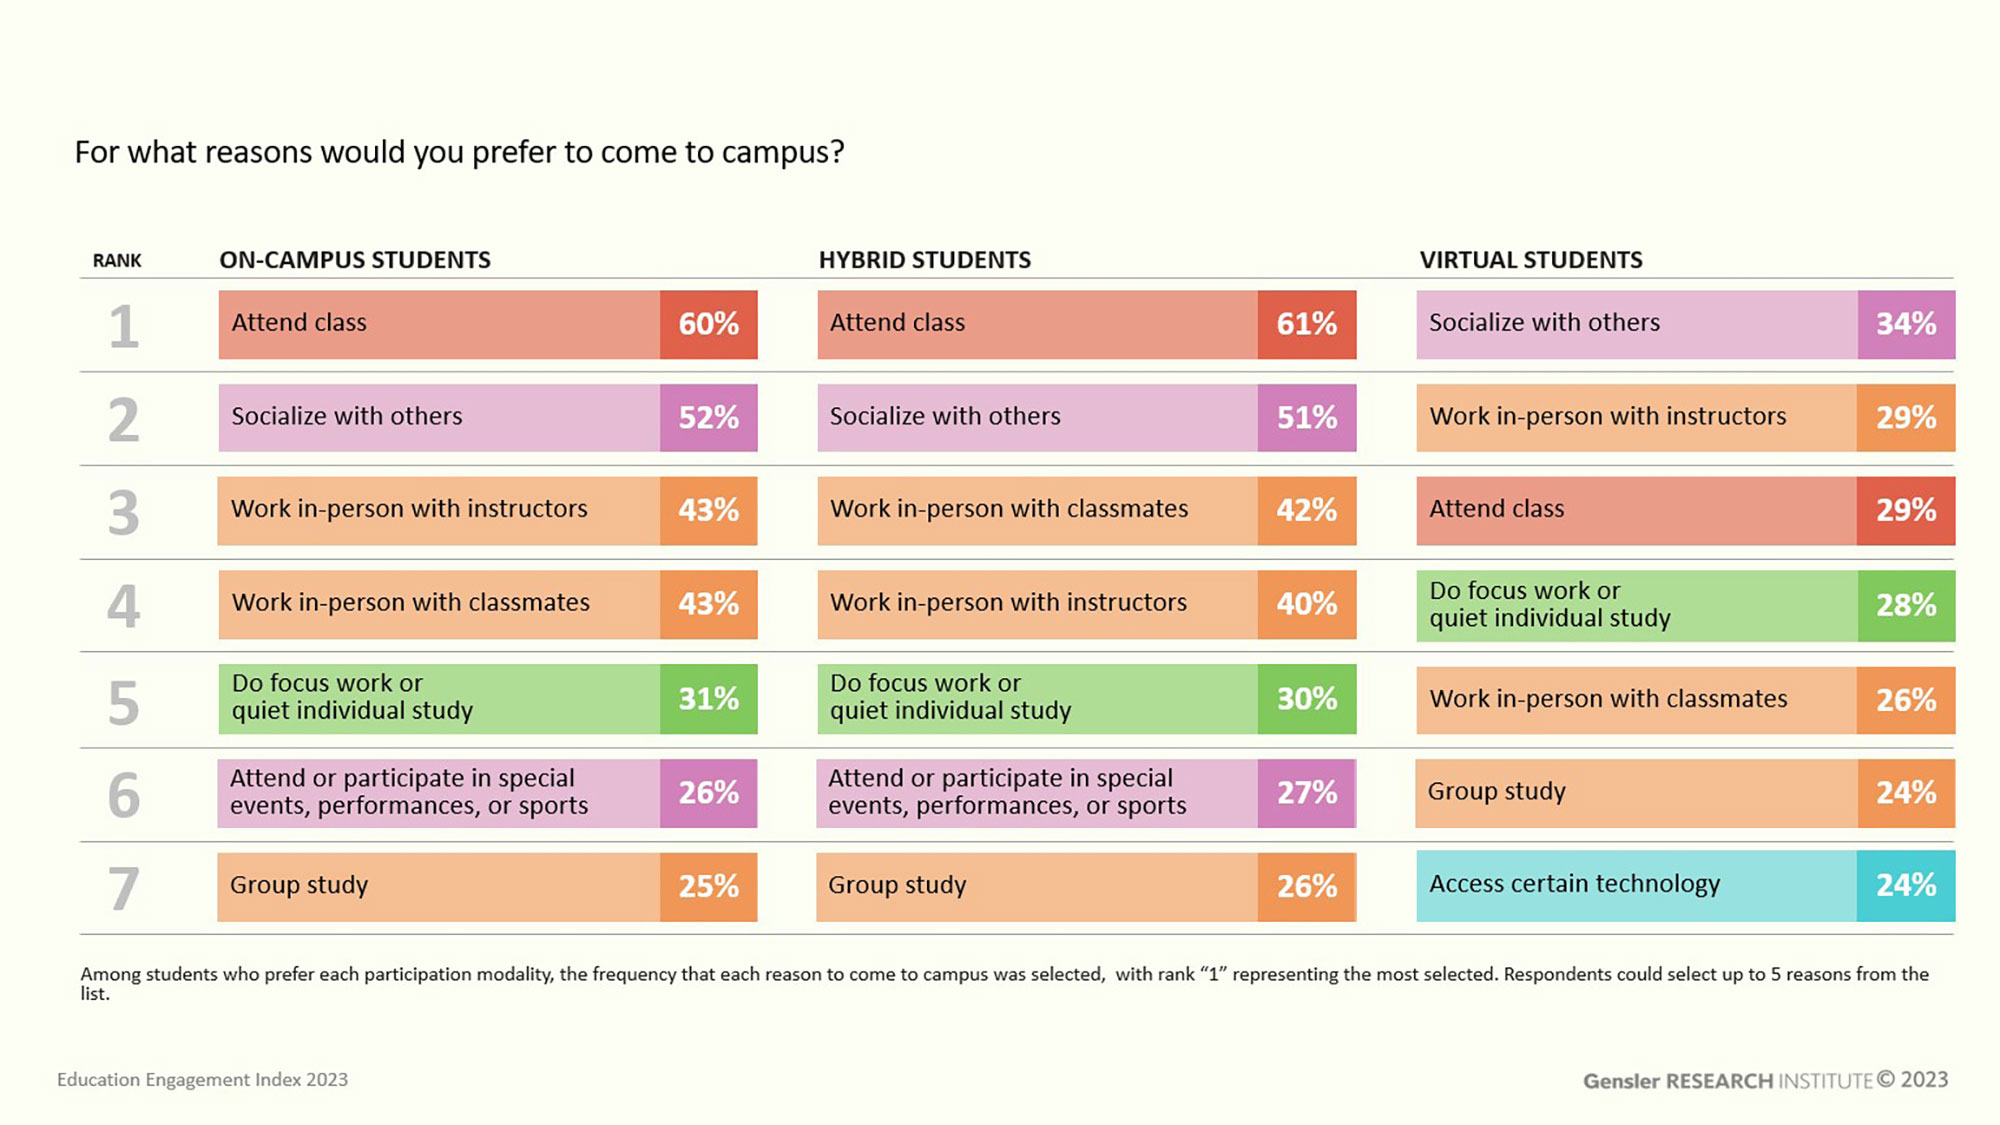
As in previous years, the opportunity to be with other people is the reason students come to campus. Regardless of preferred modality, attending class, socializing, and working with instructors are the most important reasons to come to campus.
While many campuses focus on improving their instructional spaces, this data shows the need to focus on social and meeting spaces that accommodate how students want to interact with their peers as well as their instructors. Attention must be paid to support hybrid and virtual learning, relationships, and emotional well-being of the campus community for institutions to flourish into the future.
Education Engagement Index 2023 Methodology
We deployed an online survey to an anonymous panel of 2,479 students, educators, and staff members at U.S.-based colleges and universities. Responses were collected from May 1 to June 7, 2023. This study was conducted through the Gensler Research Institute — a network of researchers and thought leaders who create insights that our education designers and strategists can use to tackle campuses’ toughest challenges, such as the student, faculty, and staff experience.
To learn more about the 2023 Education Engagement Index and how the findings relate to your Institution, please contact .
For media inquiries, email .