3 Ways the Most Innovative Companies Work Differently
May 17, 2023 | By Janet Pogue McLaurin
Editor’s Note: This blog is part of our blog series exploring insights from our ongoing workplace research.
Innovation and creativity are the hallmarks of industry leaders and are critical to the long-term success of every organization. Business leaders are constantly looking for new ways to innovate because the pace of change has never been faster. With signs of a volatile market looming, companies are striving to differentiate and create cultures of innovation that will weather any storms ahead. And according to HBR, history shows that recessions can create opportunities for innovators.
Gensler’s pre-pandemic workplace research reinforced that great workplace design drives creativity and innovation. Using six performance indicators created and validated by Future Think, we were able to create an Innovation Index focused on workers’ perceptions of the quality of innovation, creativity, and leadership in an employee’s organization. When plotted against Gensler’s Workplace Performance Index (WPI) score measuring workplace effectiveness, we saw a strong upward trend between an employee’s WPI score and Innovation Index score. As we segmented the Innovation Index scores into quartiles, we uncovered significant differences between the Most Innovative (top quartile) and the Least Innovative (bottom quartile). The Most Innovative (or “Innovators”) not only worked differently, but they used the office differently.
As office workers are returning to the office, we wanted to revisit these findings. Do innovators still work differently, and do they value the office differently in this new era of work? We followed the same research methodology from our 2016 assessment, polling over 2,000 office workers in our U.S. Workplace Survey 2022.
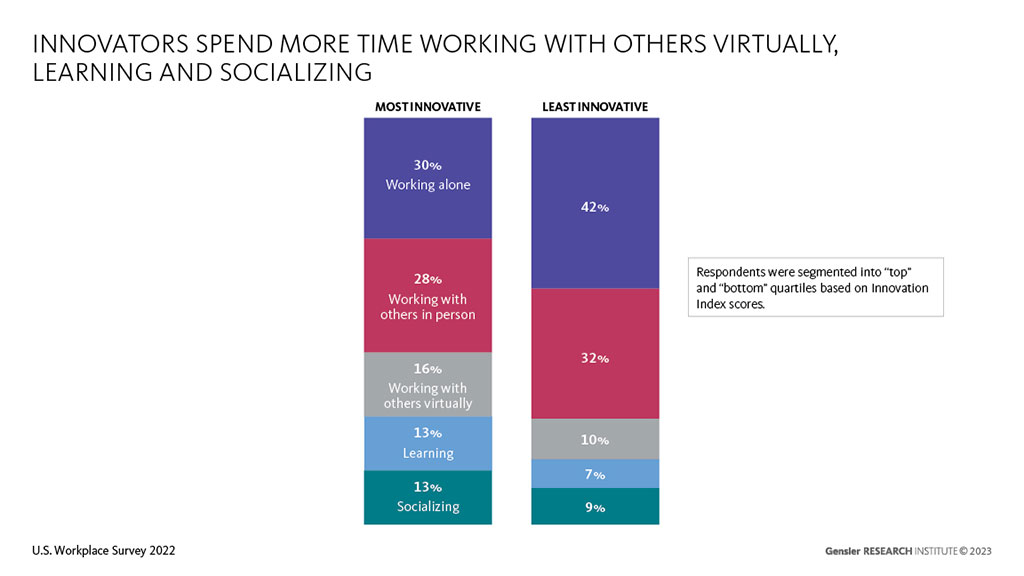
Innovators Spend Less Time Working Alone
When we compare the top and bottom quartiles, we find that the most innovative companies spend more of their time working with others virtually, learning, and socializing. This is very consistent with what we observed in 2016, where we found that innovators spent more of their time working with others, particularly working with others virtually, compared to the least innovative group. The bottom quartile reported spending significantly more time working alone in both 2022 and 2016. In our latest research, we see a more equal spread of time in all five work modes (working alone, working with others in person, working with others virtually, learning, and socializing) — in fact, time spent learning is almost double for innovators compared to the least innovative group.
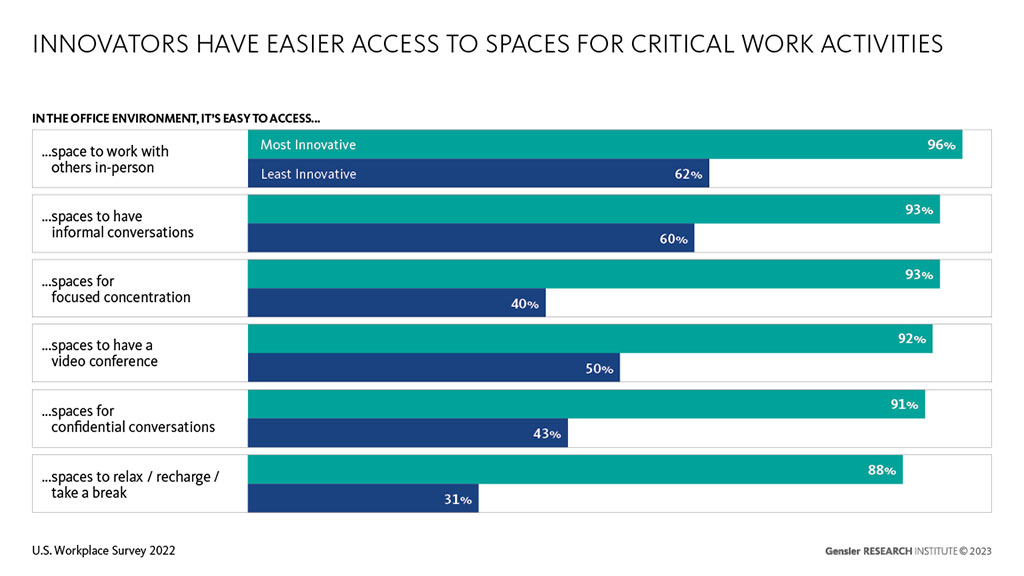
Innovators Have Different Work Spaces at the Office
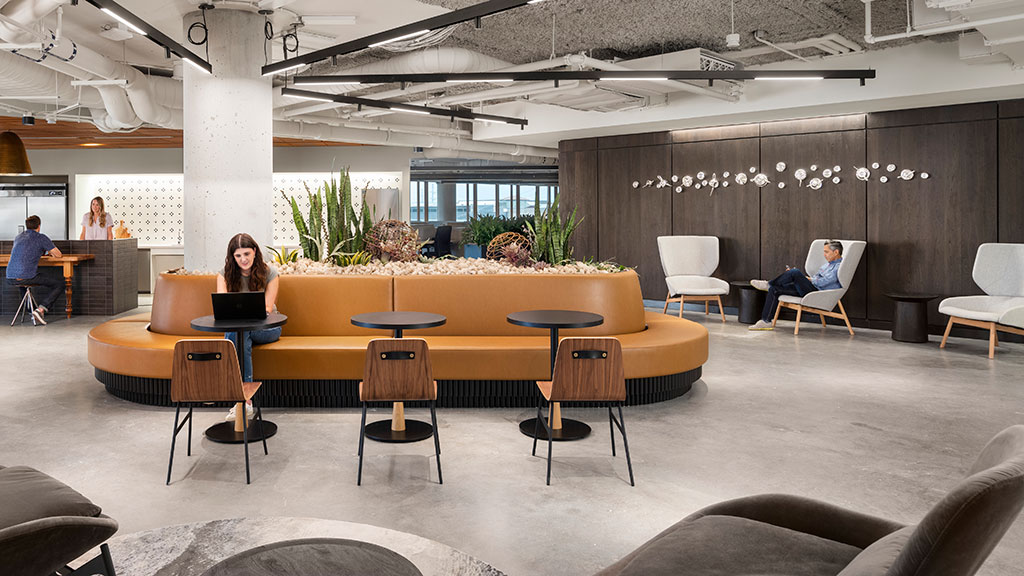
The creative process requires both time and access to physical spaces to ideate, bounce ideas off colleagues, incubate, collaborate, experiment, and refine new ideas that bring value to a company. Innovators have easier access to space for critical work activities like focused concentration, informal and confidential conversations, and video conferences. Ideas don’t always happen according to an Outlook calendar — ideation requires autonomy and inspiration. The most innovative were almost three times more likely to say it’s easy to find space at the office to relax, recharge, or take a break.
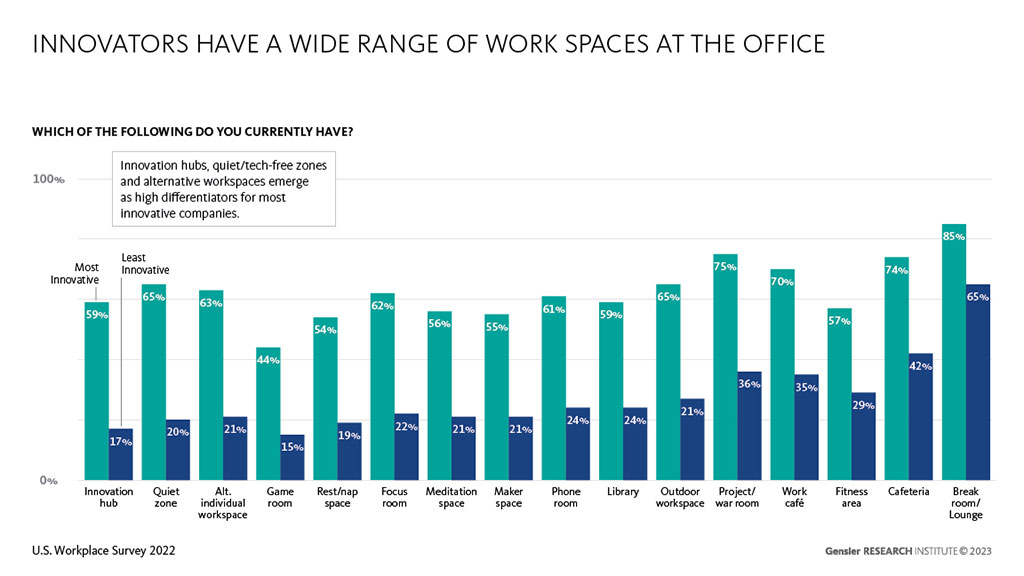
Creativity does not always occur sitting at your desk. Innovators have a wide array of spaces to choose from at the office. Innovators are approximately three times more likely to have spaces for individual work such as quiet zones, alternate individual workspaces, and focus rooms; spaces for group work, such as innovation hubs; and spaces to rest/restore, such as game rooms and rest/nap spaces.
Innovators Say They Need to Spend More Time in the Office
U.S. office workers have always been mobile — working both in and out of the office. We first started tracking mobility in 2016. At that time, the average time in the office was about 80% of a typical work week. The rest of the time was spent working in alternate office locations, client/customer sites, travel, and coworking spaces. Working from home primarily occurred after hours, not a typical part of the work week. In 2016, we found that Innovators spent less time in the office (74%) during a typical week compared to the US average (81%), and that percentage gradually decreased to 72% in 2019 and 67% in 2020, right before the pandemic.
In 2022, the Most Innovative reported spending 46% of their work week at their company’s office space at the time of the survey, compared to 51% average. In the survey, we not only asked how much time respondents are currently in the office but also how much time they ideally need to work in their company’s office space to maximize their individual and team productivity. Innovators desire to work at the office more than average — back to the 67% level we measured pre-pandemic!
Since 2016, there is even greater flexibility, choice, and autonomy for many employees. Today, Innovators not only work differently, but they also have different spaces supporting individual and creative group work. Great workplace design supports the way people work. Despite having more choice in deciding where to work inside and outside of the office, innovators are choosing to work in the office once again!
For media inquiries, email .