Workplace Surveys
Gensler’s Workplace Surveys represent our commitment to understanding what succeeds, what doesn’t, and what’s next in strategy and design.
7 Items

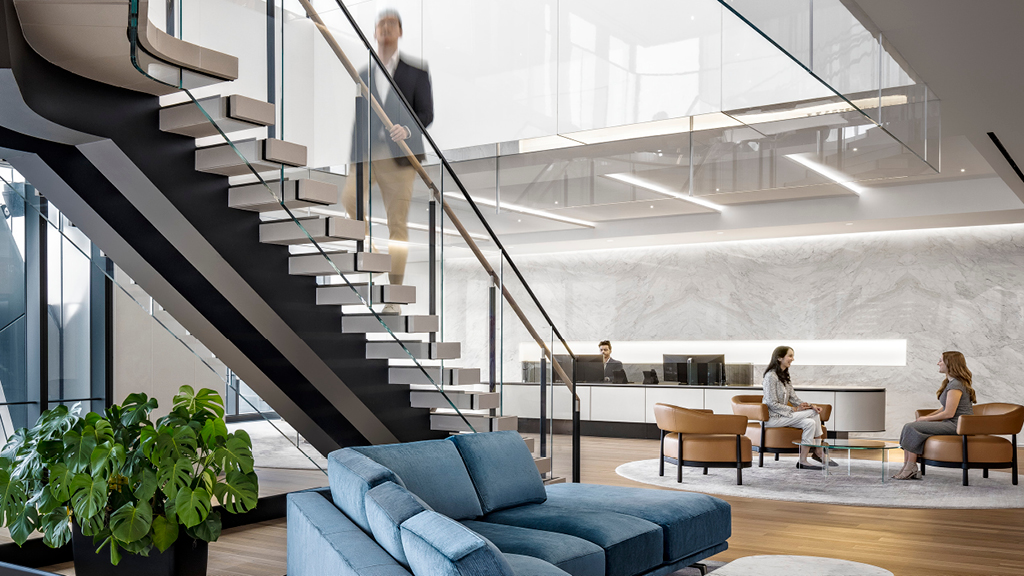
Global Workplace Survey 2026
This research explores how people work today, how the biggest users of AI reveal emerging behaviors, and how an increased focus on learning and connection is redefining the value of the workplace.

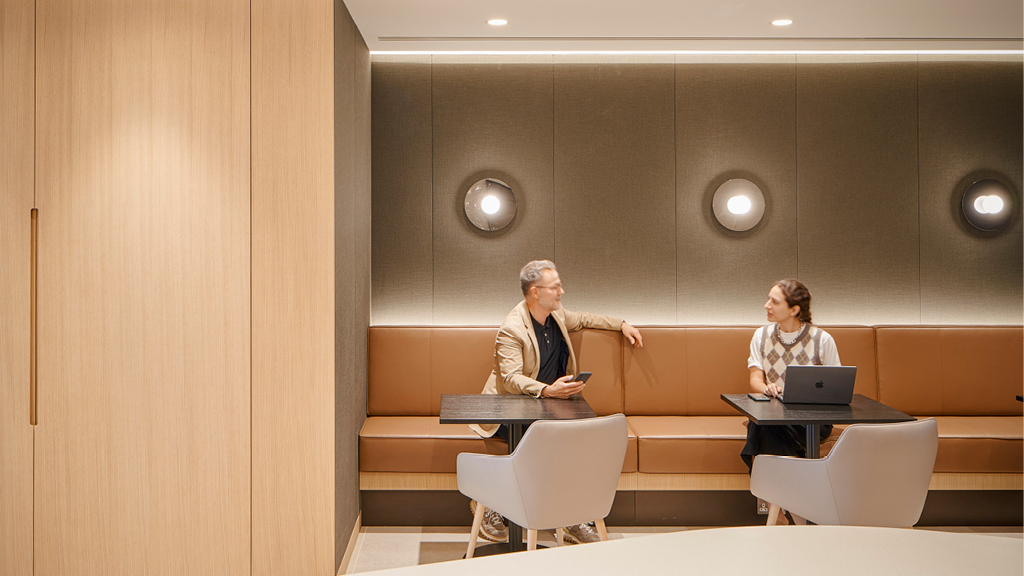
Global Workplace Survey 2025
Gensler’s Global Workplace Survey 2025 reveals the importance of in-person work and insights on how workplaces can be better designed to support all forms of work for individuals and teams.
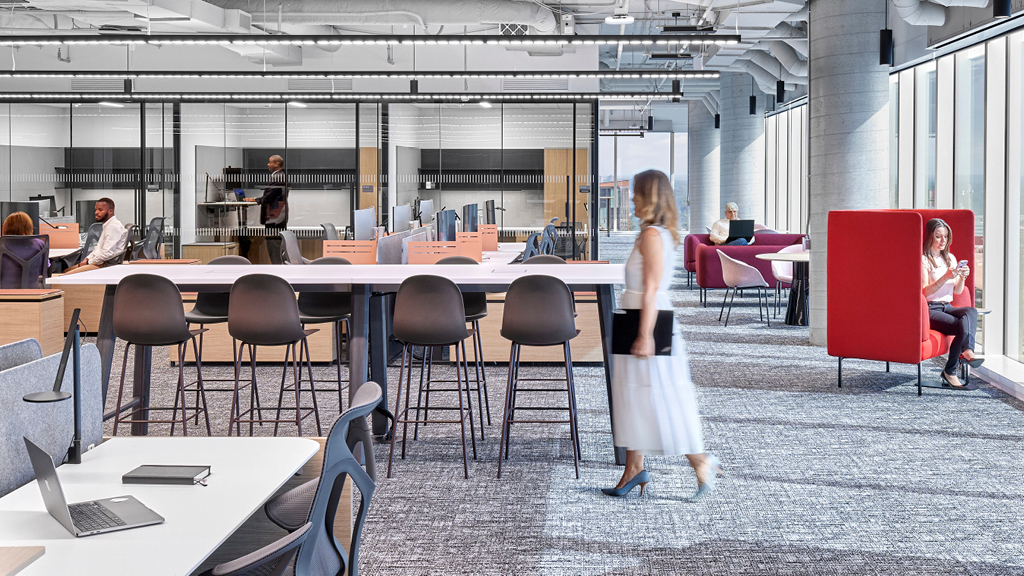
U.S. Legal Workplace Survey 2025
We surveyed U.S. lawyers to understand how they are working across five work modes — and what spaces can support them to do their best work.
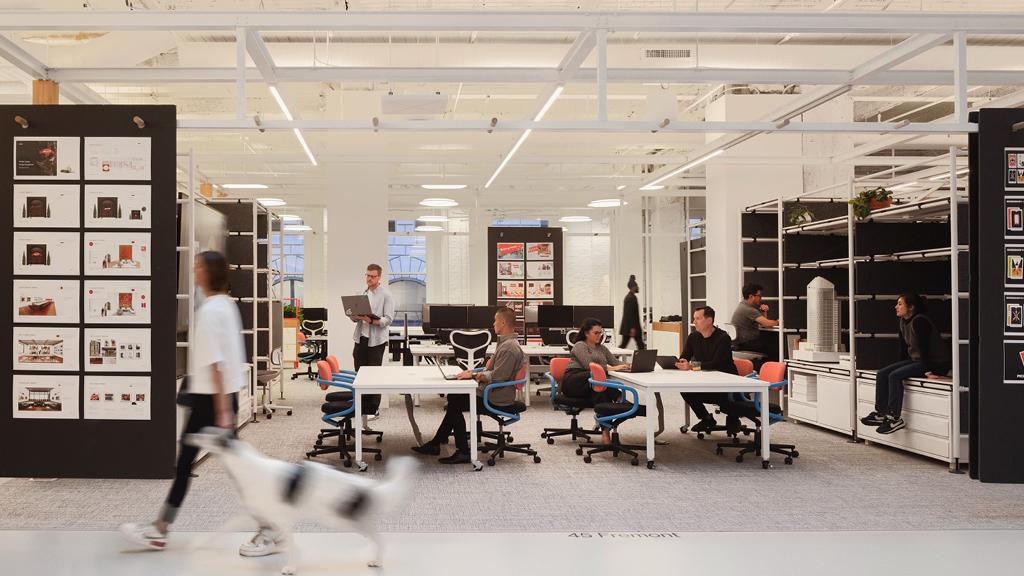
UK Legal Workplace Survey 2025
We surveyed UK lawyers to understand how and where they work, and found that this varies greatly by role. This revealed opportunities to improve the legal workspace to foster greater visibility and collaboration.
Shared Futures: Corporate Real Estate Executives’ Strategies for 2025
This report combines various sources of data and findings to provide a forward-thinking perspective on CRE professionals’ expectations, priorities, and planned actions as the industry adapts to evolving workforce needs.
Global Workplace Survey 2024
Gensler’s workplace survey reveals what matters most to design high-performing workplaces and proposes a new precedent for measuring workplace performance.

Work, Life, and the Workplace: A 2023 Survey of Office Workers in Six U.S. Cities
We surveyed remote and office-based workers across six major U.S. cities to understand the unique factors that influence why employees adopt different work behaviors.