Construction Costs Continued to Climb Through 2022
January 09, 2023 | By Andrew Starr
Construction costs have experienced many disruptive pressures due to the pandemic – from limited labor to stressed supply chains to stubborn inflation pressures. While the industry still finds itself challenged by these pressures heading into 2023, increasing interest rates and the corresponding downward pressure on demand may finally provide some relief.
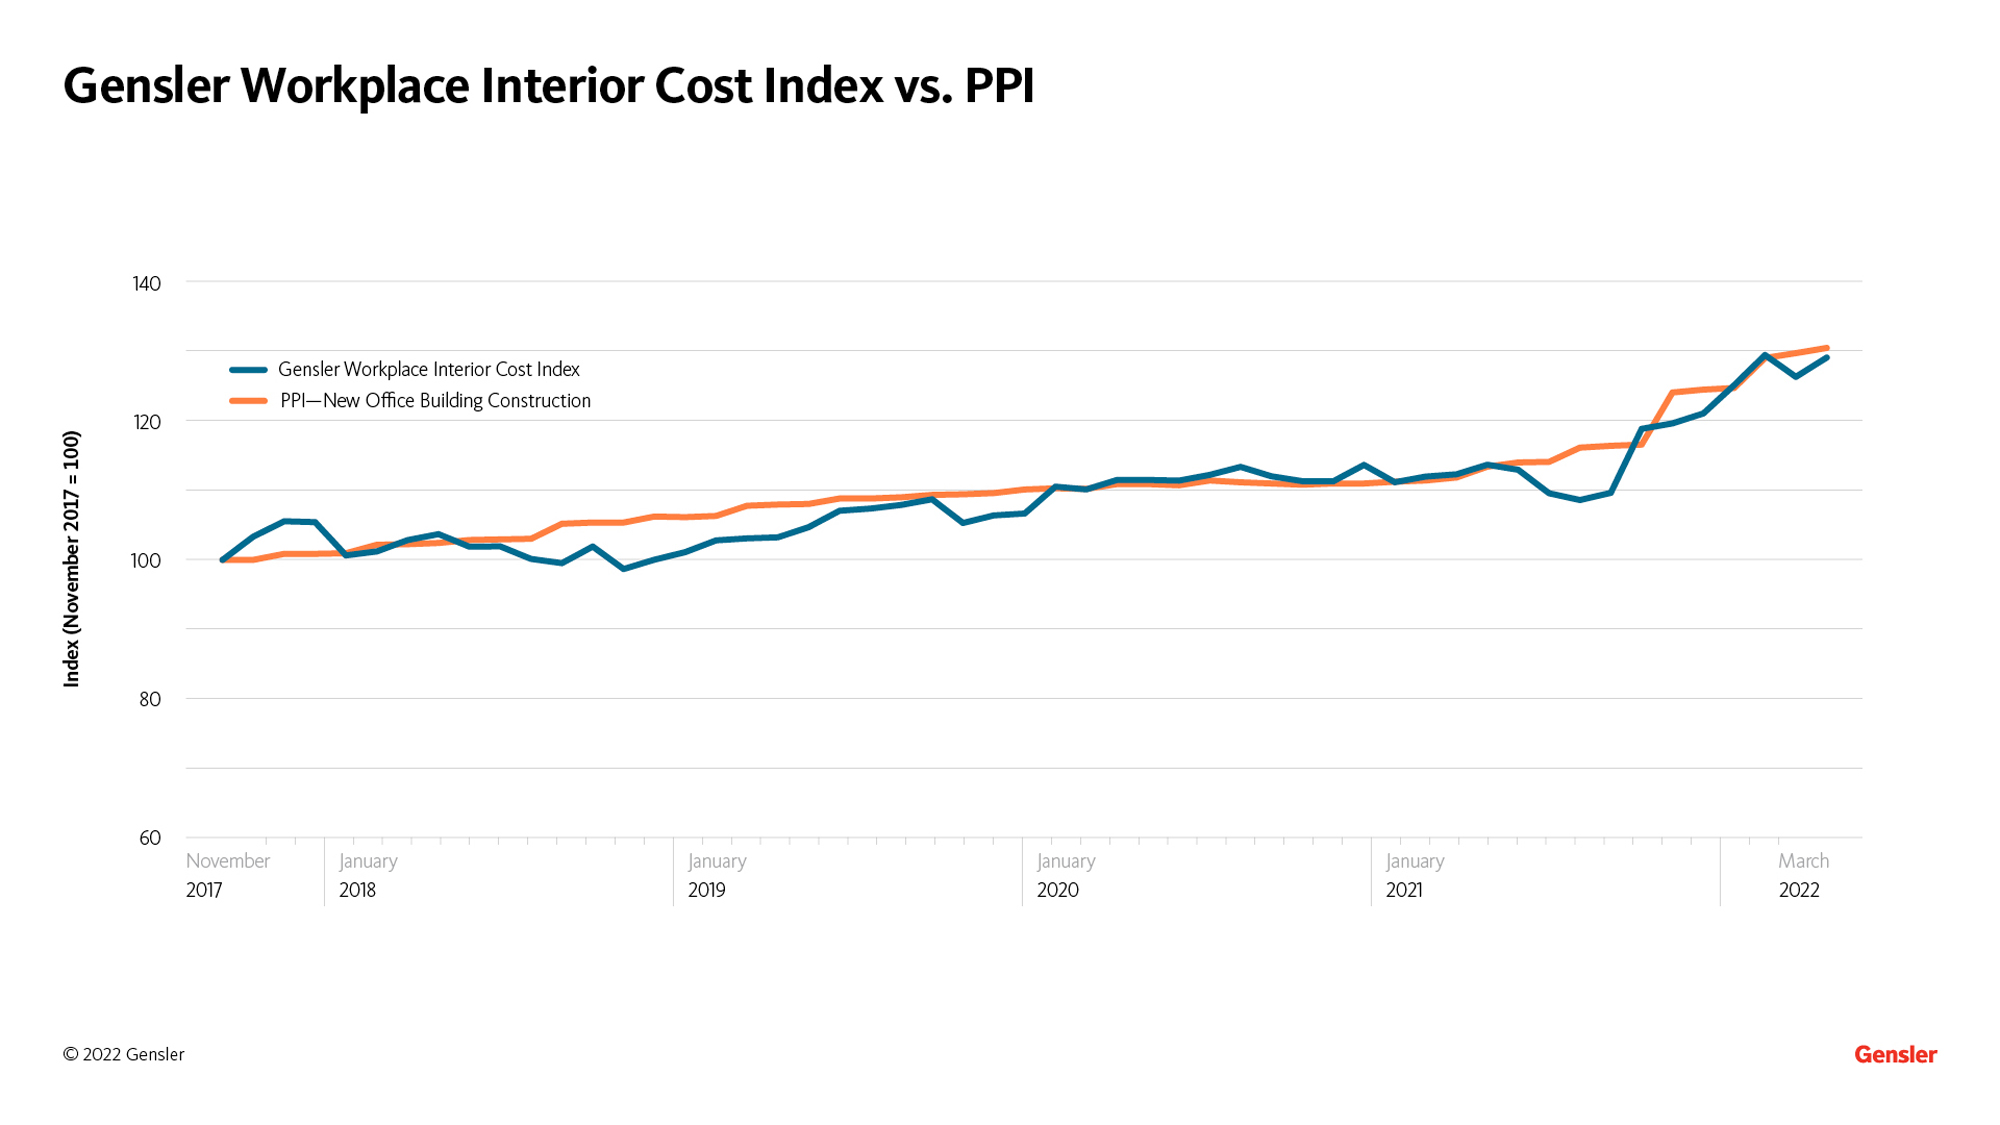
Throughout the year, Gensler continued to build out the workplace interior construction cost dataset we first shared in March 2022. With over $9 billion of hard construction costs across nearly 57 million usable square feet, Gensler’s dataset is informing clients about the pressures that are impacting construction budgets across the United States and Canada as many endeavor to envision the workplace of the future. In fact, since 2017 the cost data tracks the Performance Price Index for New Office Building Construction, suggesting it is a reliable national proxy for cost momentum.
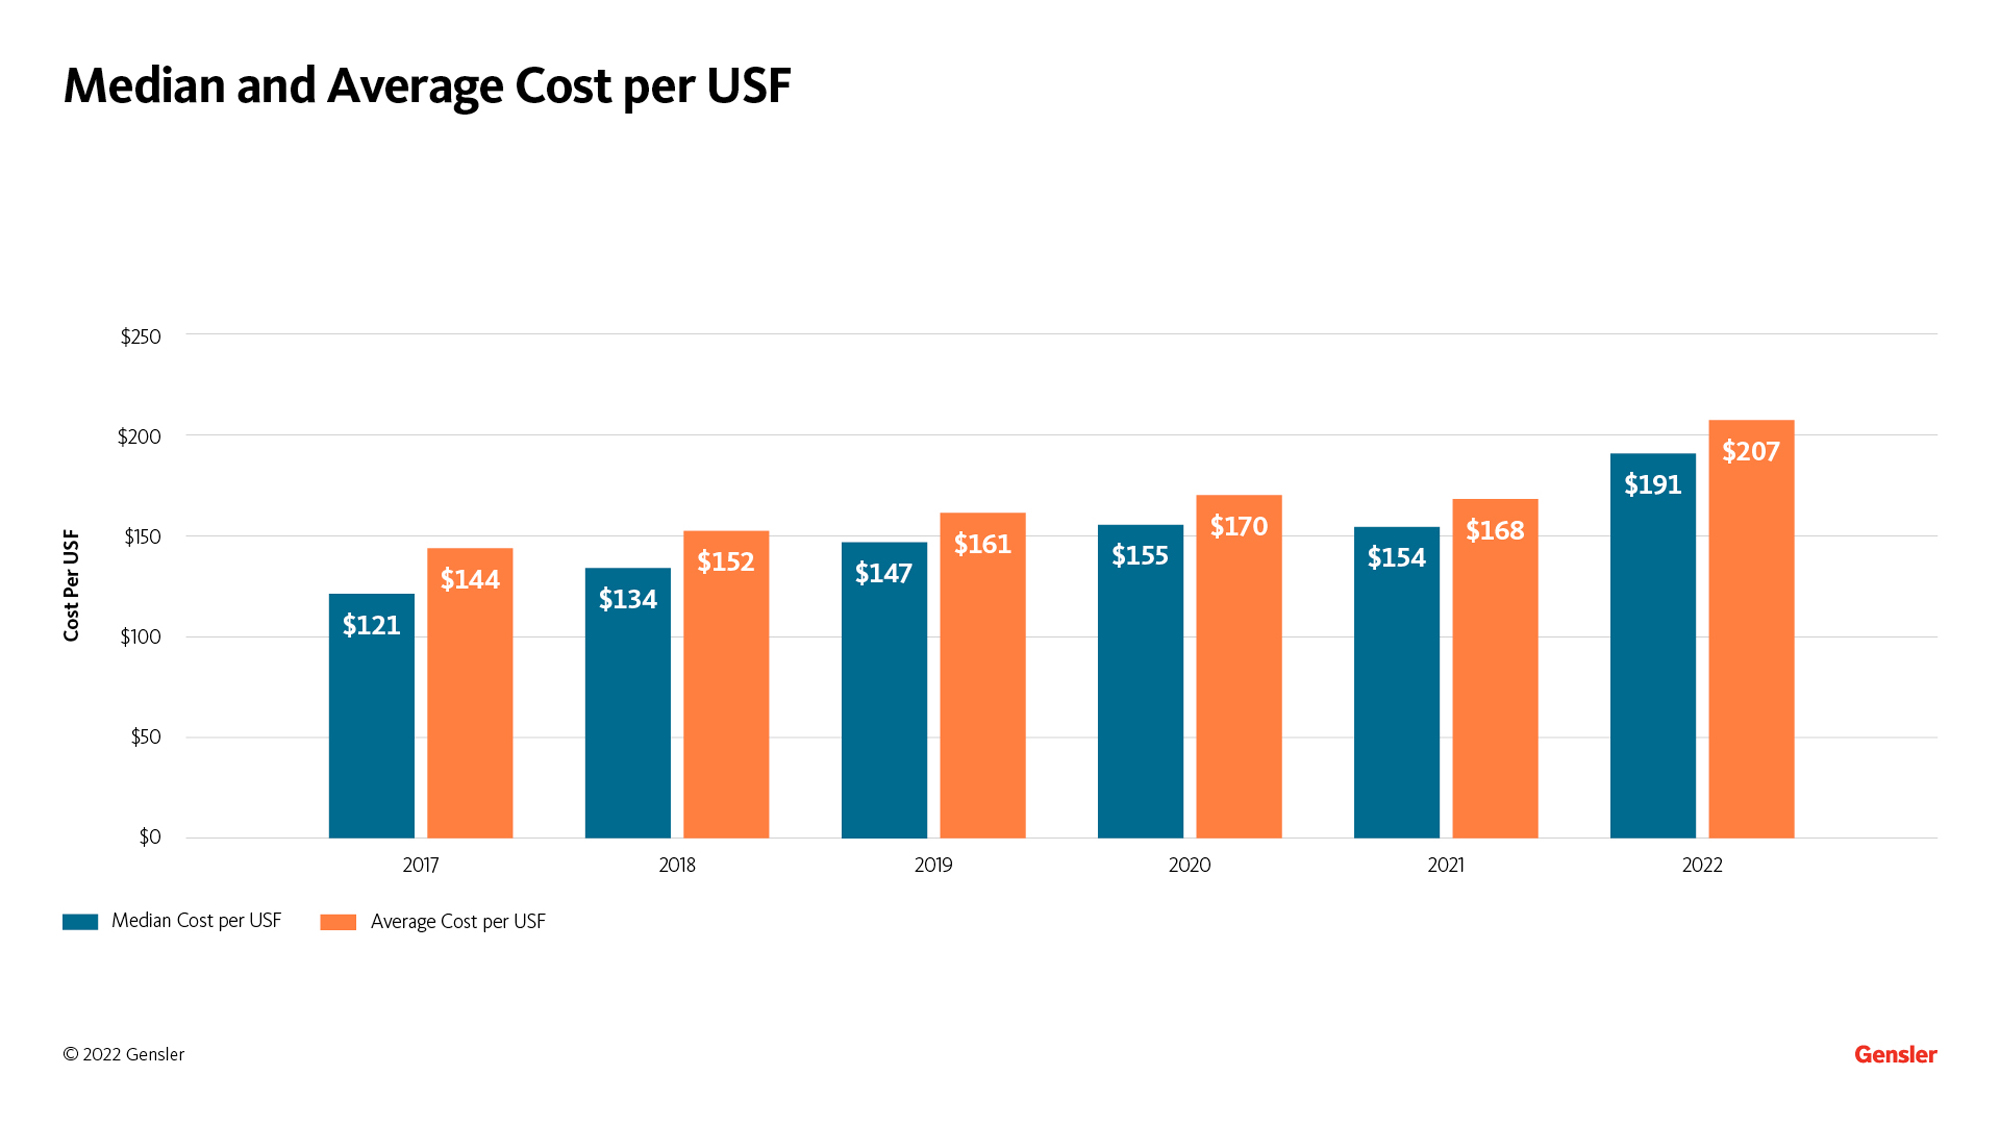
Across our North American offices through 2022, Gensler continued to see upward pressure on average and median total construction costs per usable square foot (USF). Since the end of 2021, the average and median cost of construction per USF has increased by about 23%; since 2017 this increase is closer to 44%.
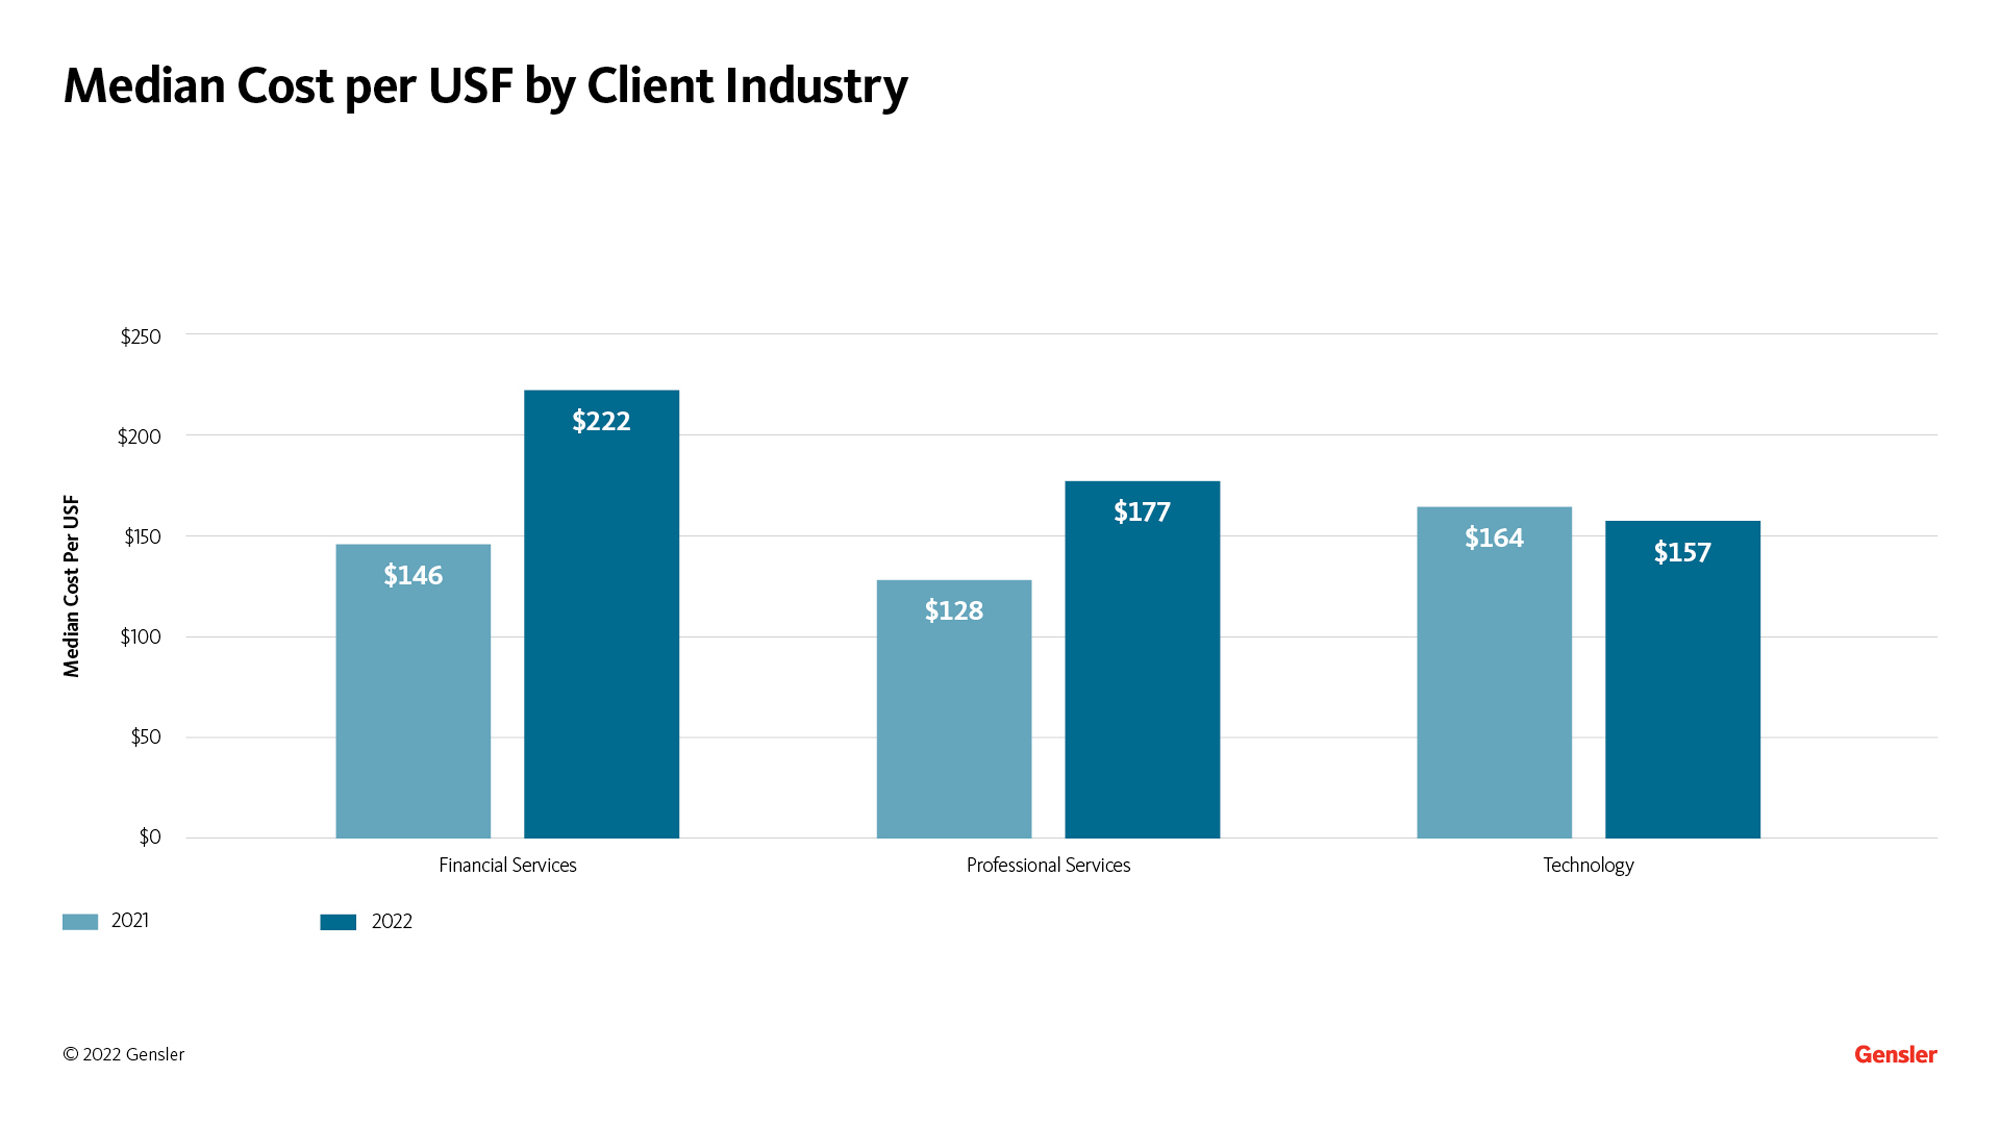
Interestingly, when we look at year-over-year cost changes by client industry, we see a divergence in the cost experiences of our clients. Financial Services clients saw the largest increase in costs year-over-year while costs for Technology clients remained relatively flat. Although it is not easy to pinpoint the exact cause of this this divergence, two trends seem to be likely contributors:
- Financial Service clients have been building out new space as they have optimized footprints and more heavily adopted hybrid workspaces.
- The pace of Technology build-outs has slowed year to year and recent headcount shifts at major technology employers have resulted in more cost-conscious endeavors.
Finally, Gensler’s most recent cost data is showing a minimal cost premium for projects that are pursuing LEED certification. Specifically, mechanical, electrical, and plumbing (MEP) costs show an approximately$8 per USF premium versus non-LEED projects.
In 2023, Gensler will launch our Cost Intelligence Dashboard. Featuring the latest cost data on our North American Workplace Interior projects, this resource will help clients better understand the potential costs of their upcoming projects and allow us to share trends and insights from our broad portfolio.
For media inquiries, email .