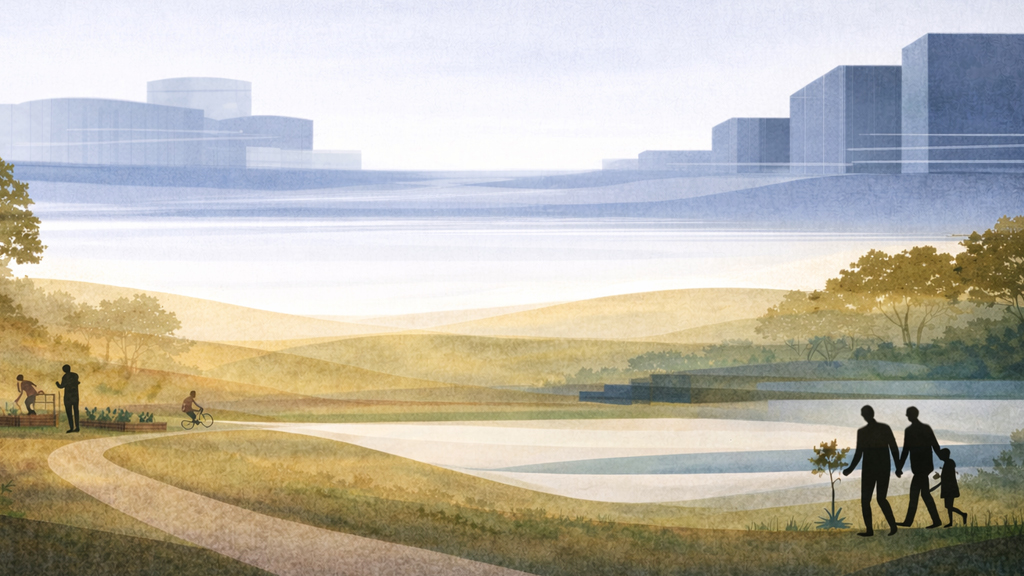
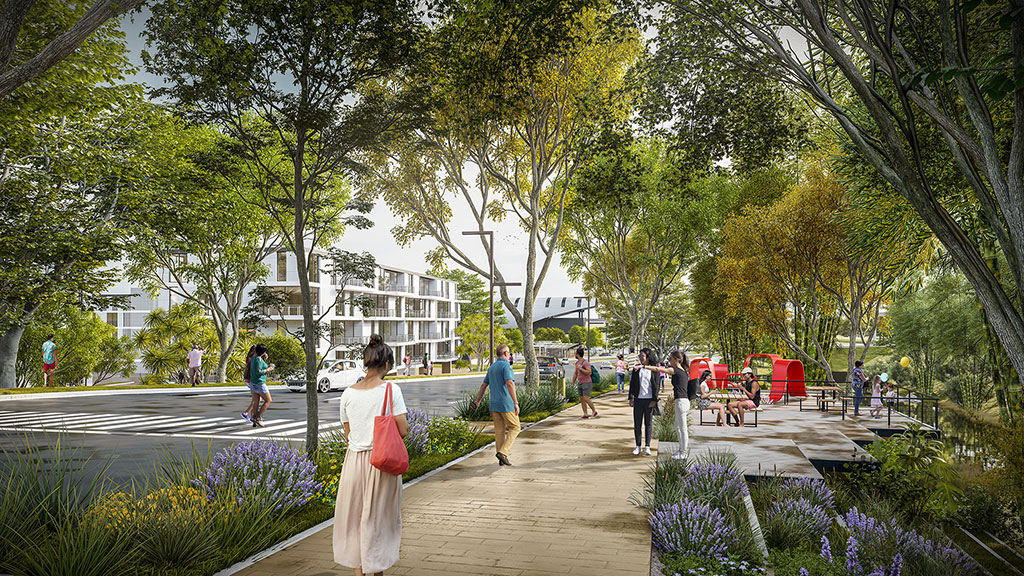
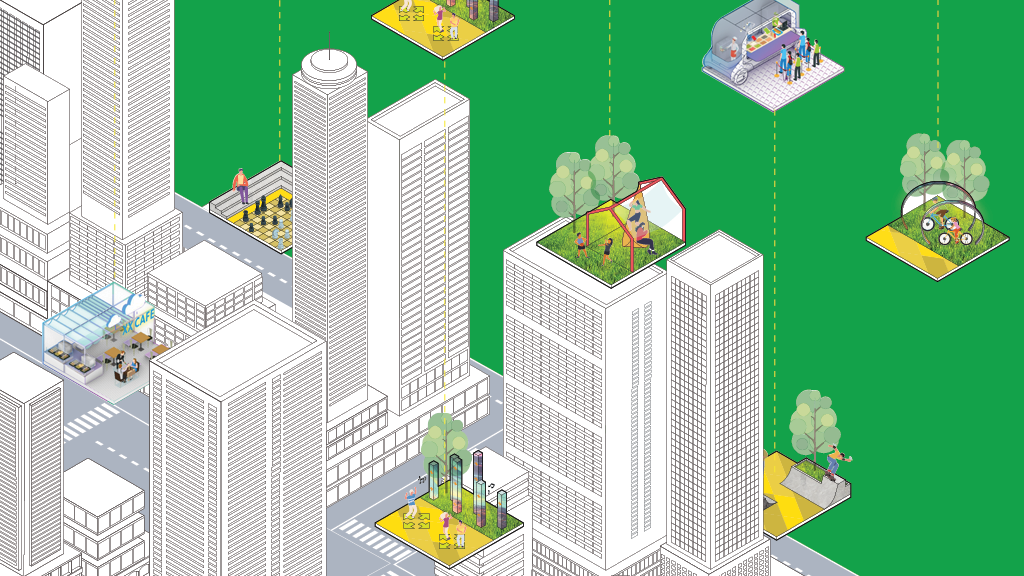
Future of Cities
Redefining the future of cities as ecosystems of multiuse, multi-generational, 20-minute neighborhoods.
LATEST REPORTS & ARTICLES

Research
City Pulse 2025
Gensler surveyed 33,000 people across 65 cities to uncover what makes a city magnetic — how it attracts new residents and keeps them wanting to stay.

Blog
The Top 10 Cities People Don’t Want to Leave
Gensler’s 2025 City Pulse survey reveals the top cities where people not only move to, but also stay long-term.
Research
Empowering Communities with Data Center Design
Rapid data center growth in Northern Virginia has raised community concerns, highlighting the need for better design, transparency, and engagement to build public trust.

Research
How African Youth Are Shaping City Futures
The study highlights why embracing local youth perspectives is essential for sustainable urban growth, equitable development, and thriving global partnerships.

Research
The Transit-Oriented Development Opportunity Index
By blending spatial analysis with design strategy, the Transit-Oriented Development Opportunity Index™ offers not just a method for site selection, but a framework for interagency dialogue and public engagement.

Research
What Makes a Great City Brand
The report explores how cities can build impactful, lasting identities through the lenses of culture, infrastructure, economic vitality, and visual storytelling.
Research
Redefining the Future of Urban Wellness (Phase 2)
Post‑pandemic cities are rethinking green infrastructure to improve wellness, connectivity, and climate resilience through better urban design.

Research
Redesigning Data Centers for Environmental Impact
This research explores strategies for reducing the environmental footprint of data centers through site selection, material choice, and modular design.
Research
Equitable Urbanism
Equitable urban design can foster generational wealth by leveraging community-driven housing solutions, inclusive development strategies, and innovative approaches to home ownership and investment.

Research
Redefining Affordability Through Inclusive Living
This research presents actionable insights for designers, policymakers, and developers seeking to create truly inclusive communities that support human diversity across life’s stages.

Research
Guidelines for Public Engagement in Latin America
Effective public engagement in Latin America requires tailored approaches for each community.
Blog
The 20 Cities Attracting the Most Newcomers
New city residents often leave within five years. To remain successful, these magnetic cities must also engage and retain their new populations.

Research
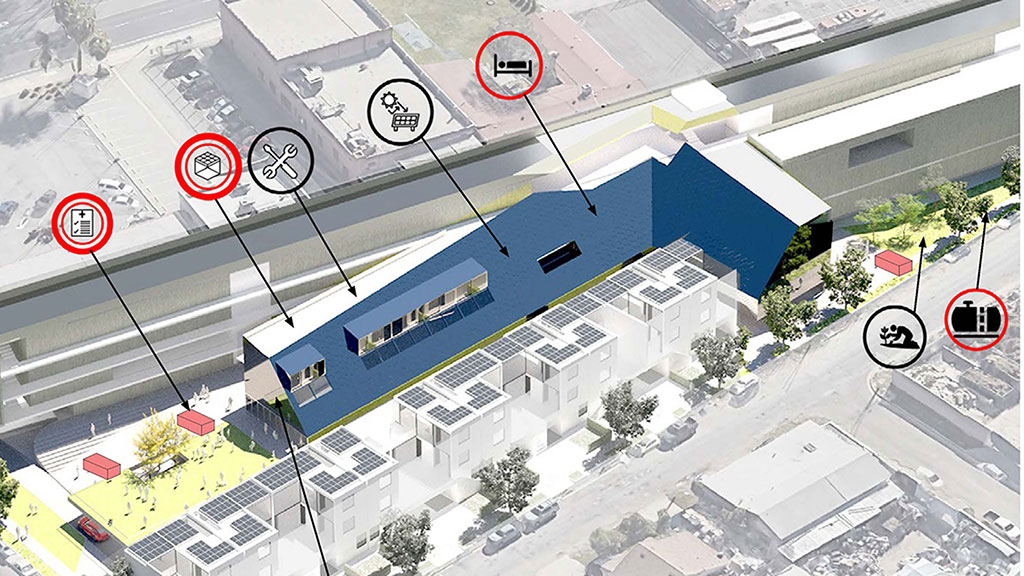
Ending Homelessness
Interim supportive housing, using small, prefabricated tiny homes on temporary sites, is presented as a rapid, cost-effective, and scalable strategy to address the growing crisis of homelessness.
Blog
What Draws People to Cities — and What Makes Them Stay?
Gensler’s City Pulse 2025 research offers insights into the factors attracting people to cities and compelling them to stay.
Blog
How Cities Can Establish Resilient Communities
To mitigate potential damage and risk, cities can form resilient communities to proactively prepare for, respond to, and recover from a disaster.

Research
Designing Amphibious Structures
The design of amphibious, modular structures, leveraging existing port infrastructure and small components for sunlight penetration, offers a scalable solution to create new marine habitats and restore coastal biodiversity in disturbed waterfront environments.
Blog
Designing a New Future of Cities Through Wellness and Experience Design
How cities can take an active role in fostering healthier, more fulfilling urban lives for residents and visitors.

Blog
Creating a More Resilient Future With Green and Thriving Cities
As the demand for sustainable and liveable cities grows, urban planners and architects are adopting innovative strategies to harmonise built and natural environments.
Blog
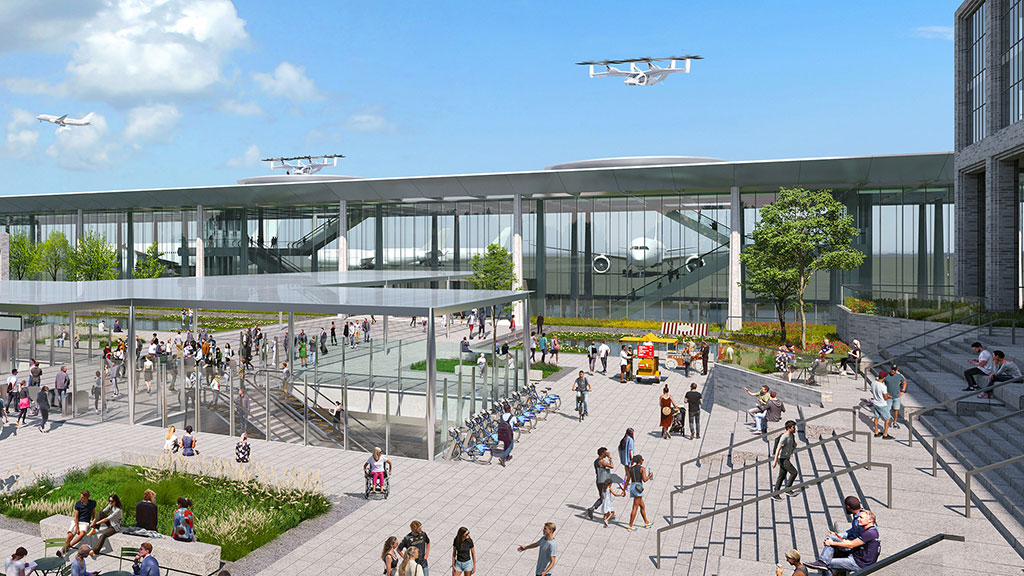
Urban Air Mobility Is Here. Here’s How Cities Can Adapt.
Advanced air mobility is ready for launch. The next crucial step: preparing buildings and infrastructure to get this sustainable mobility solution off the ground.
Blog
A New Vision for Urban Design in Tropical Climates
Through thoughtful, climate-responsive design, seemingly adverse conditions can become a distinct advantage for tropical cities.
Blog
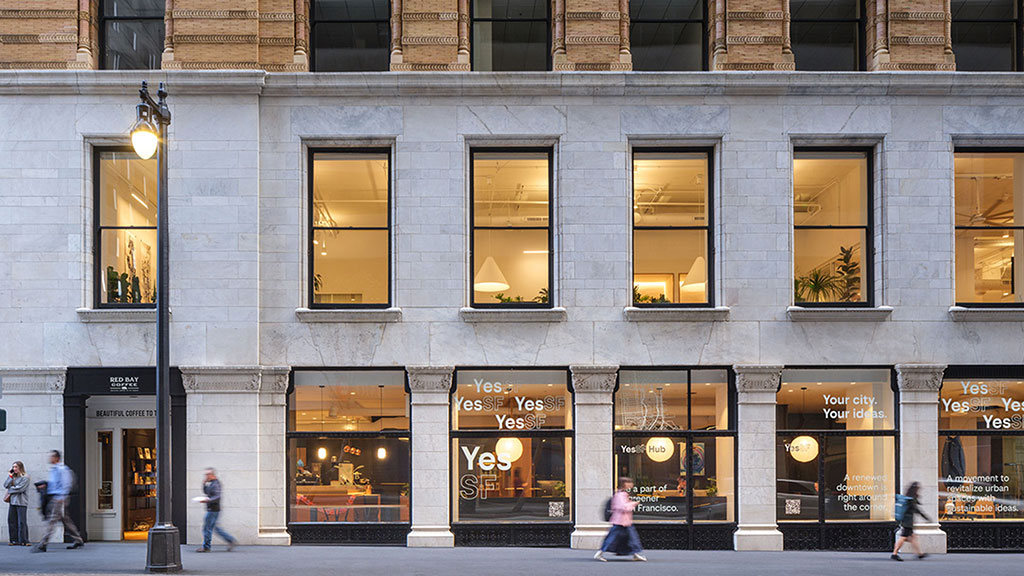
Urban Design’s Renaissance: How San Francisco Is Leading the Way
Cities everywhere are rethinking not just how they look and function, but how they can better serve the people who live in them. Few cities are as poised to lead this transformation as San Francisco.
Blog
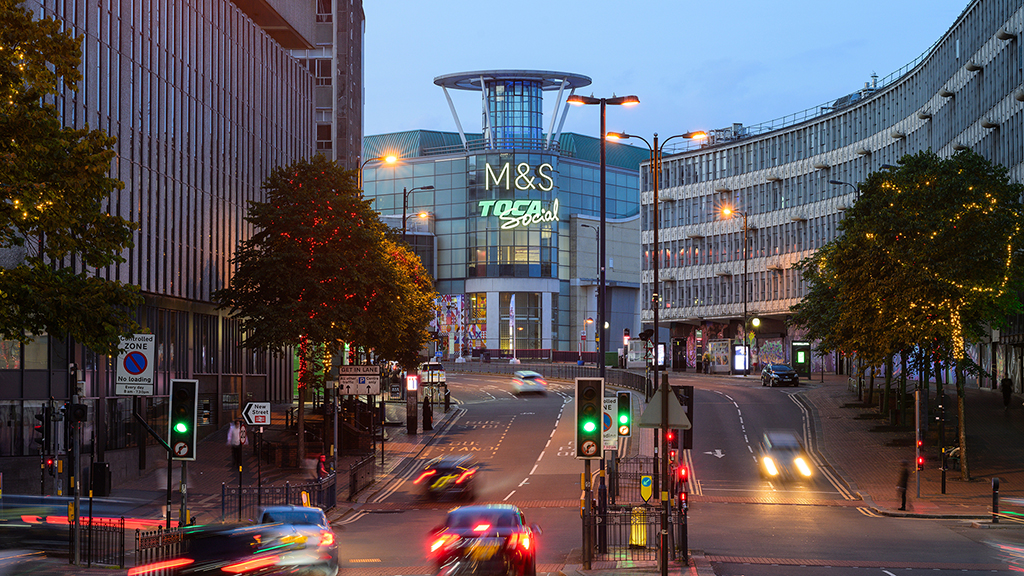
Birmingham’s Renaissance: The City of 100 Quarters
How the city’s next evolution is embracing both innovation and heritage to shape a vibrant future.
Blog
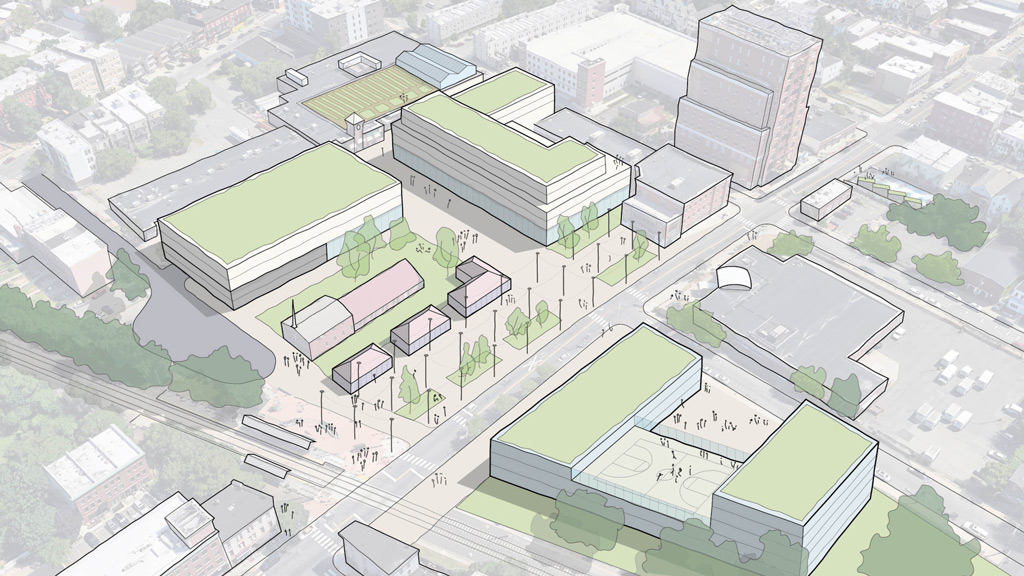
10 Opportunities for a More Resilient and Equitable Jersey City
Listening to the local community to improve climate justice, health, safety, and equity.
Blog
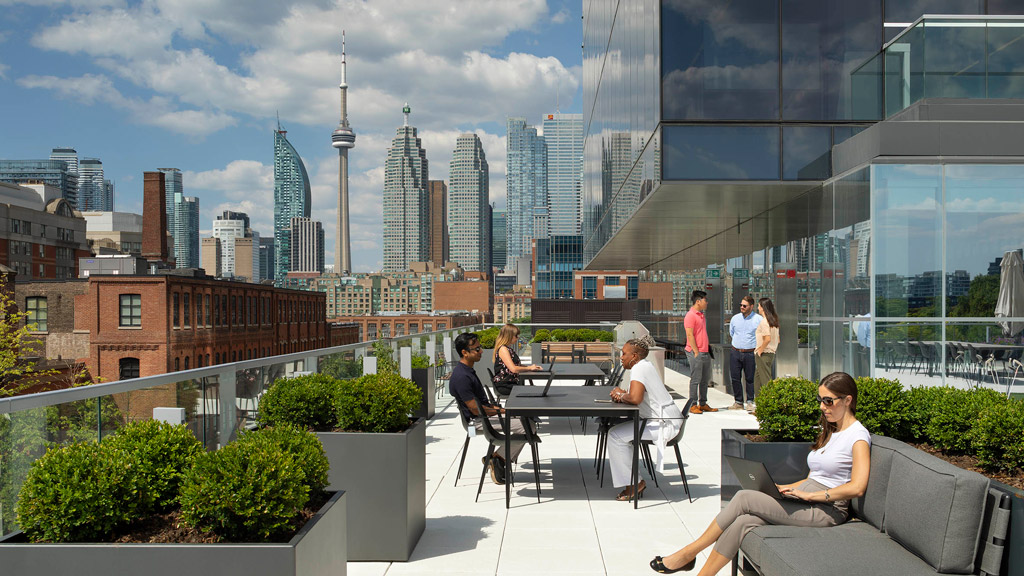
Toronto’s New Deal Highlights the Importance of Healthy Cities
Here are three areas Toronto can focus on to bring people downtown, improve accessibility, and provide a better central business district experience for all.
Blog
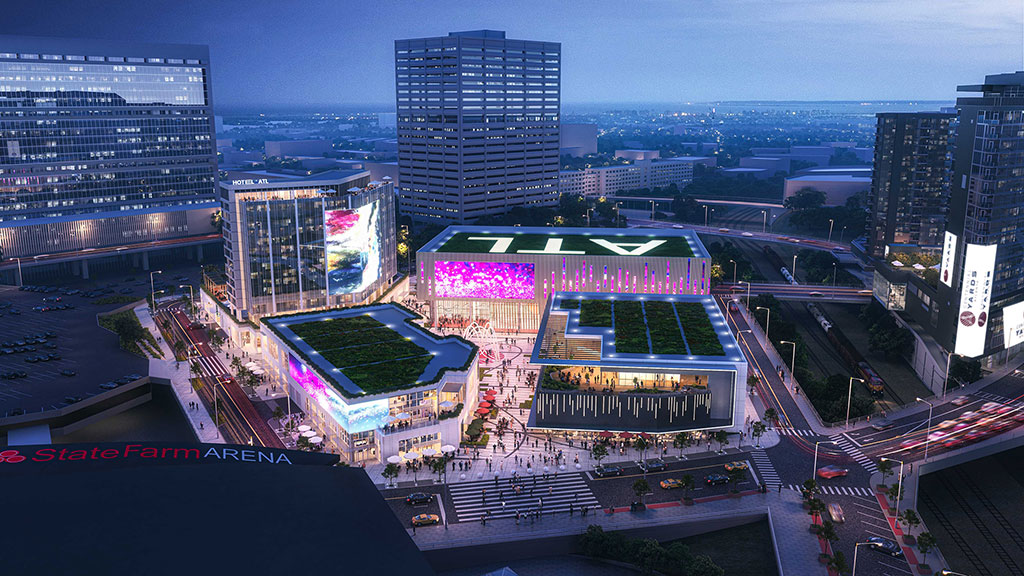
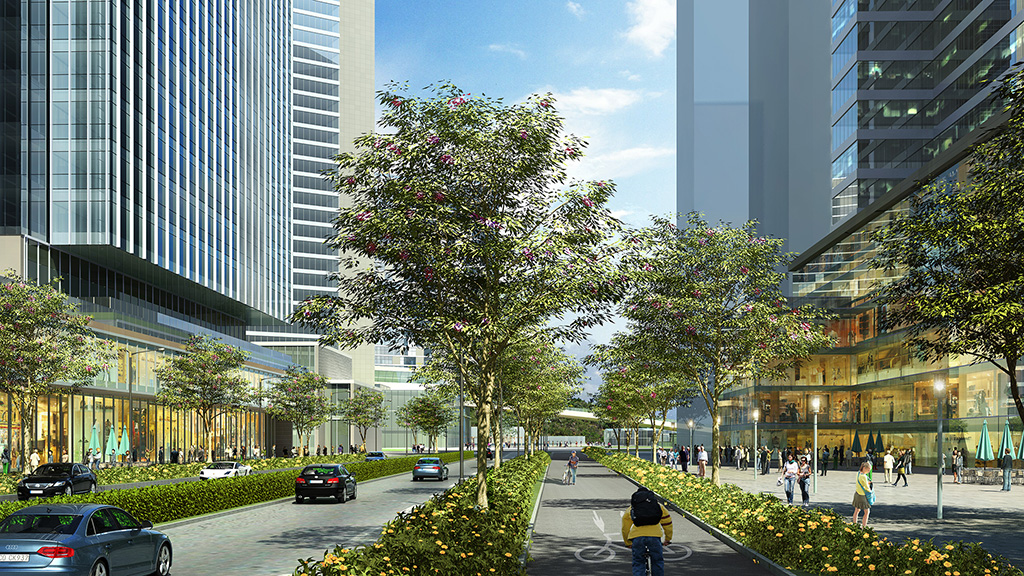
Trends to Watch: The Future of Cities Relies on Multiuse Districts
Gensler’s Mixed Use & Retail Centers leaders discuss the opportunities shaping the future of cities and multiuse districts.
Blog
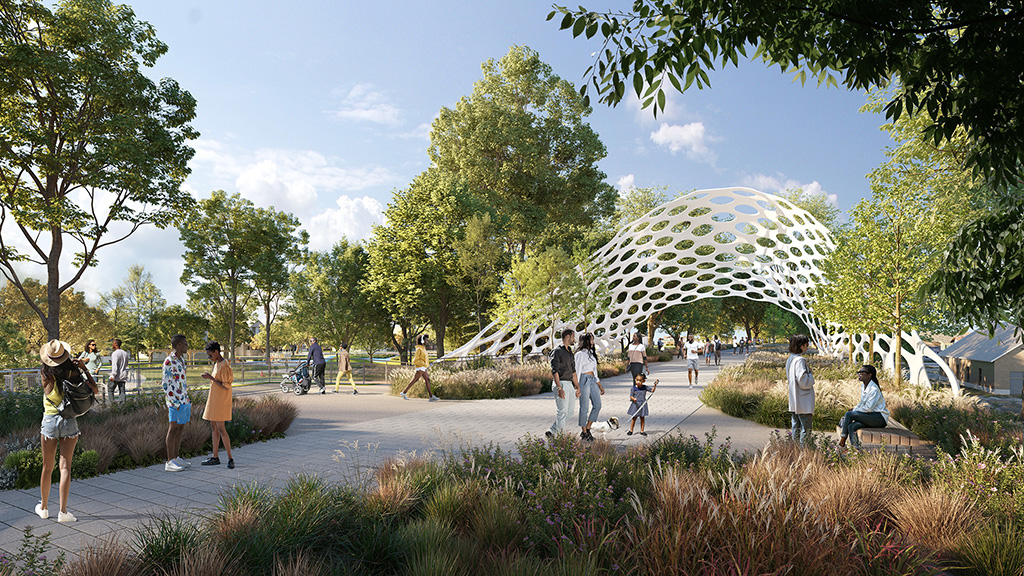
Designing Safe, Walkable Cities for Future Generations of Children
Thoughtful urban design can transform cities into vibrant, inclusive spaces where children can thrive, connect, and grow.
Blog
How Urban Design and Educational Spaces Can Combat Child Loneliness
Through thoughtful urban design, we can create inclusive, supportive environments where children can safely explore and learn outside traditional classroom settings.
Blog
Trends to Watch: What Other Cities Can Learn From New York City’s Conversion Boom
As U.S. cities experience high commercial real estate vacancy rates and housing shortages, developers have an opportunity to invest in and convert stranded assets.
Blog
How Life Sciences Developments Can Redefine Urban Areas
Sciences R&D developments are migrating to amenitized urban areas, unlocking opportunity for architectural innovation.
Blog
Trends to Watch: Building City Identities to Become Destination Brands
How can brand positioning and a compelling narrative help cities create global destinations and build strong brand advocates?
Research
The Return of the City
We examined how global perceptions have shifted from 2021 to 2023 across 15 global cities to understand the obstacles and opportunities facing cities today.
Blog
Trends to Watch Reshaping the Future of Cities and Urban Living
Gensler’s Cities & Urban Design leaders discuss what’s next for the future of cities.
Blog
Maximising Urban Space: 3 Strategies for Solving the U.K.’s Housing Crisis
Addressing the U.K. housing shortage will require a multifaceted, strategic approach, recognising the urgent need for land to accommodate new homes and infrastructure.
Blog
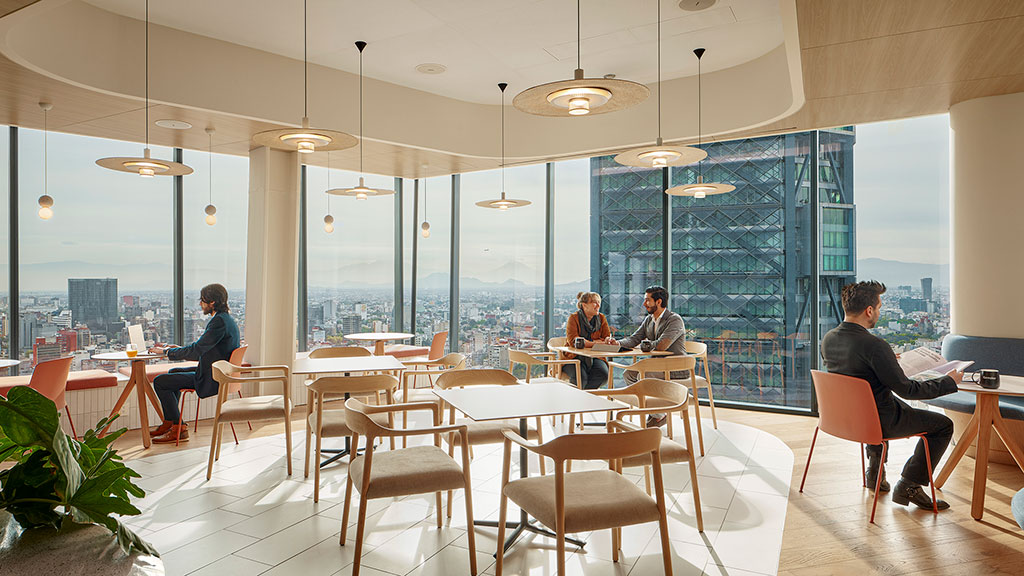
Mexico City Is Reckoning With Explosive Economic Growth Alongside a Mounting Water Crisis
Despite an influx of capital and accelerated economic growth, Mexico City is grappling with a water shortage and affordability challenges.
Blog
Ecological Urbanism Is the Future for Cities in the GCC
As more people move to urban areas, it is essential that our urban spaces be designed in a more ecological manner.
Research
Redefining the Future of Urban Wellness in China
We created a framework and adaptable urban design toolkit to promote wellness in Chinese cities at the neighborhood level.
Blog
Equity and Aging in the 20-Minute City
By designing spaces that prioritize universal design principles and connectivity, we can create more accessible, purposeful places for seniors.
Blog
Gensler’s City Pulse Retrospective Tracks the Complex Shifts in Urban Life
Our latest cities research reveals that despite pain points, the desirability of cities persists.
FEATURED CITIES PROJECTS
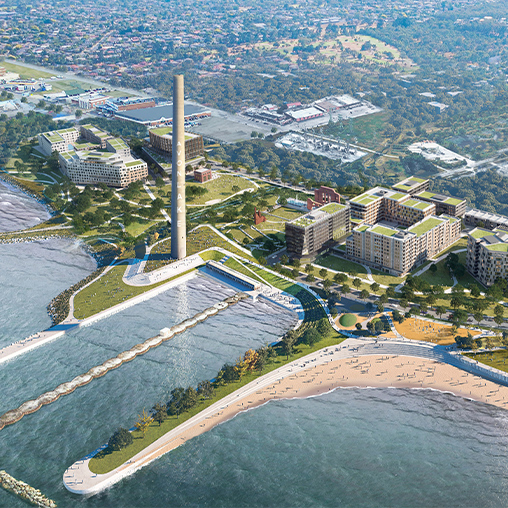
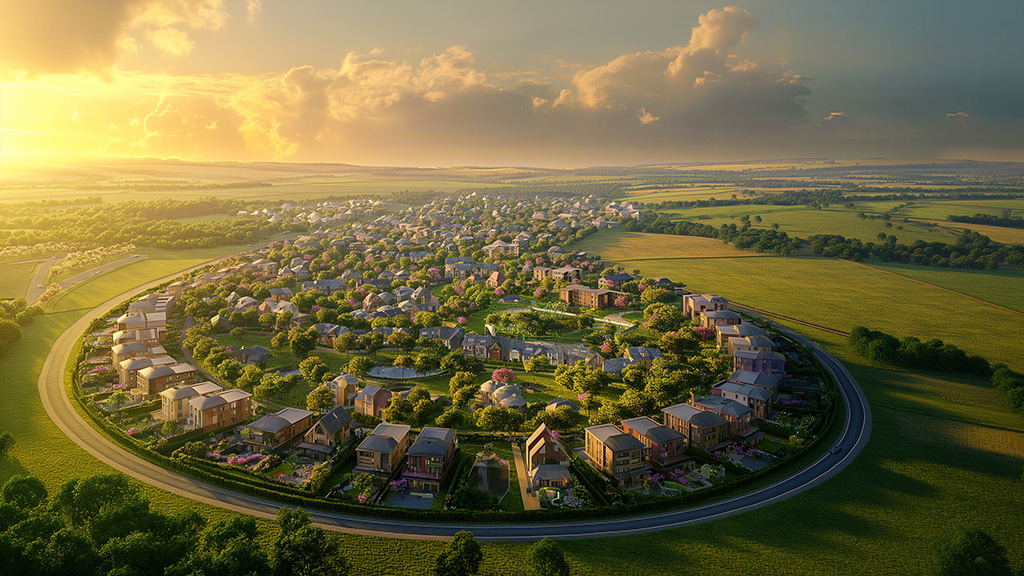
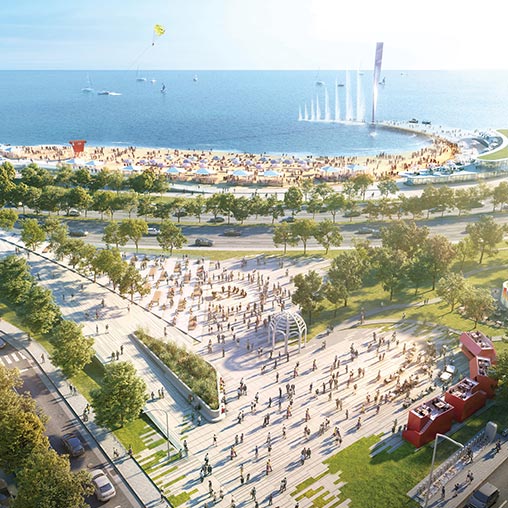
Avon Lake Renewable Master Plan
Avon Lake, Ohio
Gensler worked in collaboration with the City of Avon Lake and ALERG to reposition the site of a recently decommissioned coal-fired power plant.
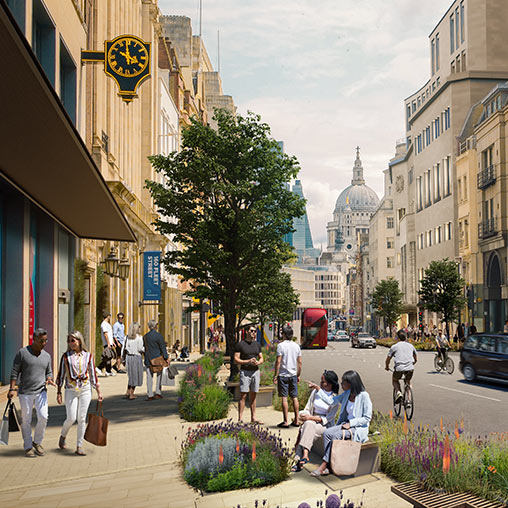
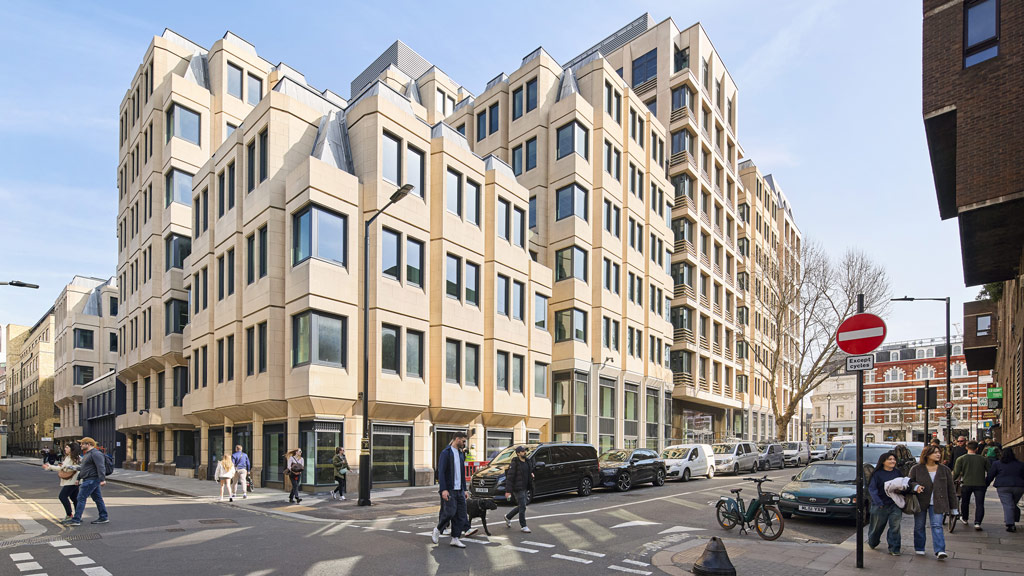
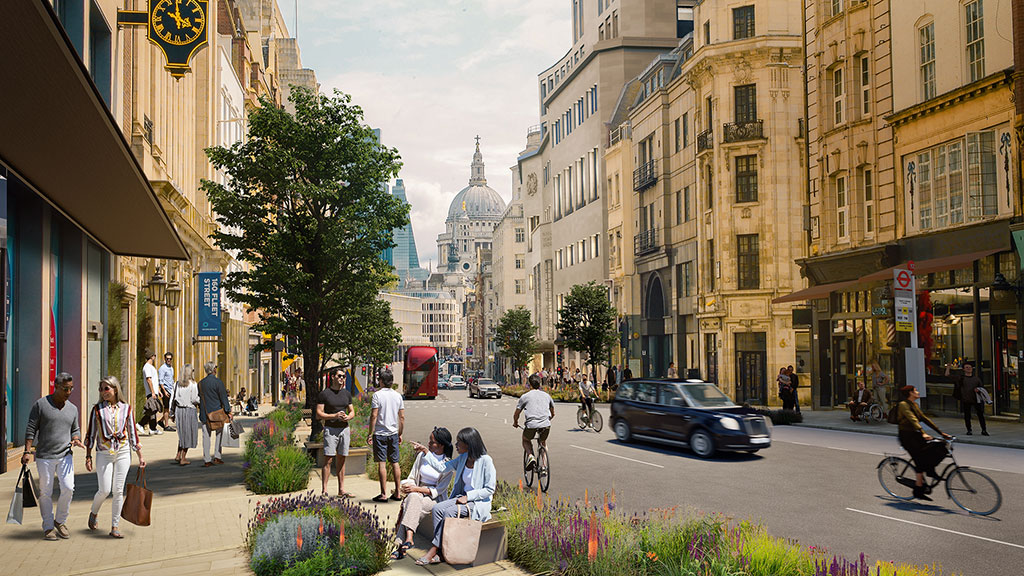
Fleet Street Quarter Public Realm Strategy
London, United Kingdom
Gensler has been working closely with Fleet Street Quarter BID, the City of London, and key stakeholders and businesses to define a vision to create a sustai...
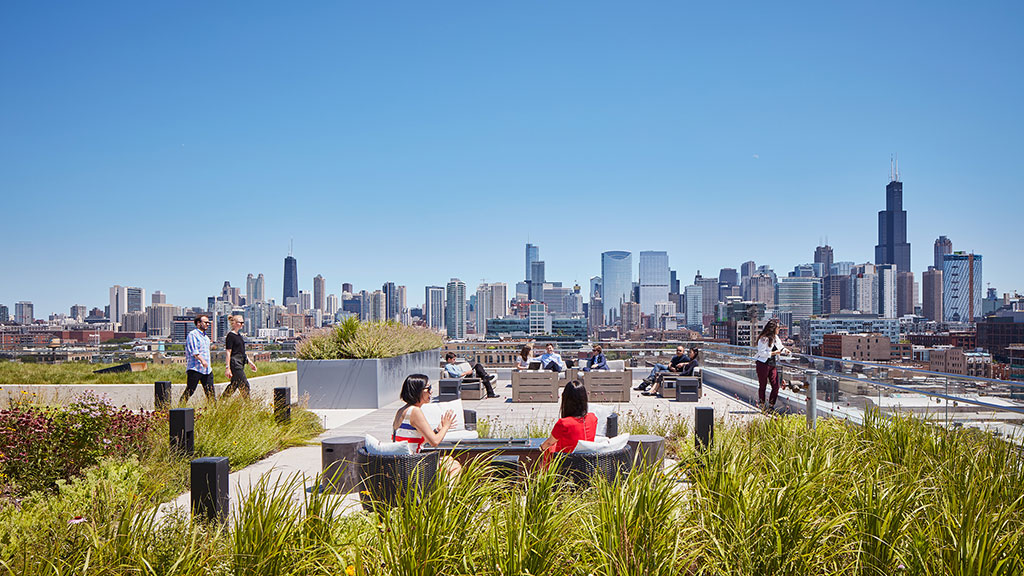
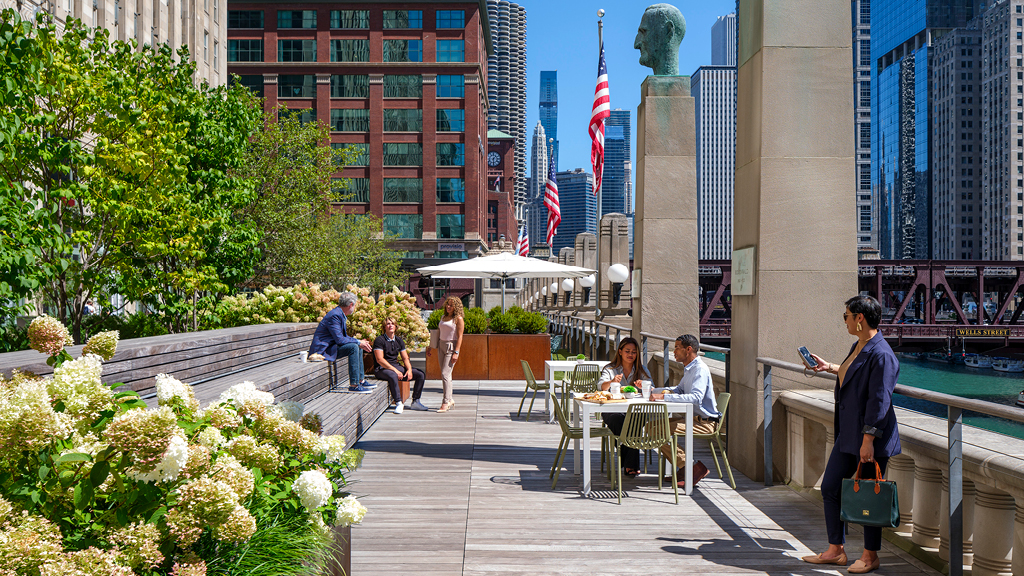
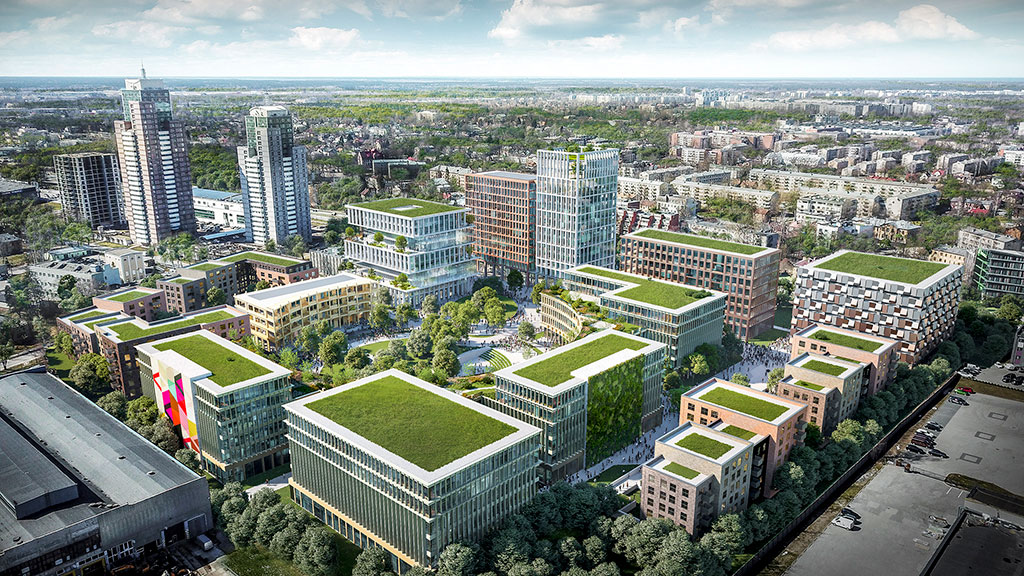
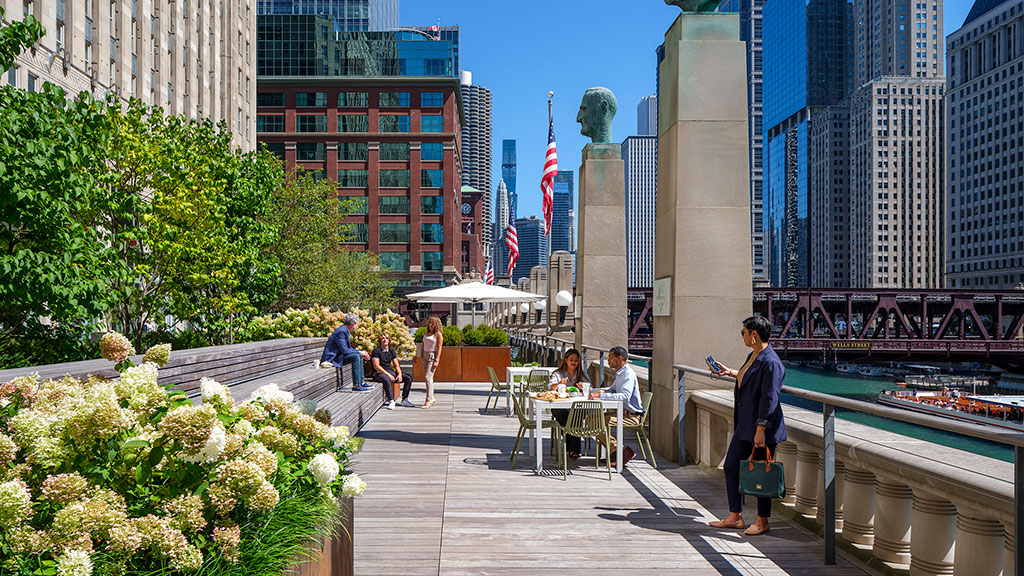
Reimagining North Michigan Avenue
Chicago, Illinois
Gensler and a team of key real estate leaders studied the innovations and interventions that could elevate the North Michigan Avenue experience.
CITIES & URBAN DESIGN NEWS
-
 Gensler Press Release
2025New Research from Gensler Unveils the Magnetic Forces Shaping Cities — and Why People Choose to Stay
Gensler Press Release
2025New Research from Gensler Unveils the Magnetic Forces Shaping Cities — and Why People Choose to Stay -
Bloomberg CityLab
2025Bloomberg CityLab interviewed Gensler leaders about how cities can attract new residents, particularly young people and families, by converting office buildings into new housing to revive downtowns. -
Challenger Cities
2025Challenger Cities featured Gensler Global Cities Research Lead Sofia Song on a podcast about “The Magnetic, Messy Cities People Don’t Leave.” The discussion was anchored by Gensler’s City Pulse Survey findings, which delve into what makes cities not just livable — but lovable.
Interested in working with us?