Graph by Gensler: Spatial Analytics for Design
August 12, 2020 | By Molly Murphy and Richard Tyson
Predicting the future, while never easy, is even more variable today. Understanding the rapidly evolving relationship between human behavior and the design of space has never been more critical. To explore this connection, we built Graph, a new way to analyze and spatialize data from multiple sources to better understand and advise on the impact of design, layout, occupancy, movement, behavior, and experience.
How can we design for confident shopping? How can space planning and programming empower new forms of teamwork? What does it mean to enable teaching and learning in an online/offline environment? How do we improve the healthcare experience to support doctors, nurses, and patients? And how will we measure progress to drive positive change? The answer is better data — and better spatial analytics for that data.
Capitalizing on the data-rich built environmentAs people, organizations, and buildings get more digital, they generate exponentially more data. But the tools we have for understanding that information are old and fragmented. We have sensors that create one or more dashboards. We have computer-aided facility management systems (CAFM), building management systems (BMS), integrated workplace management systems (IWMS), occupant surveys, WiFi tracking, facility apps, concierge apps, digital touchpoints — each with technology in its own data silo.
To get the most out of their investments in facilities and operations, clients need real insights about the meaning of all this data for design, and how it reveals patterns of use, value, and experience.
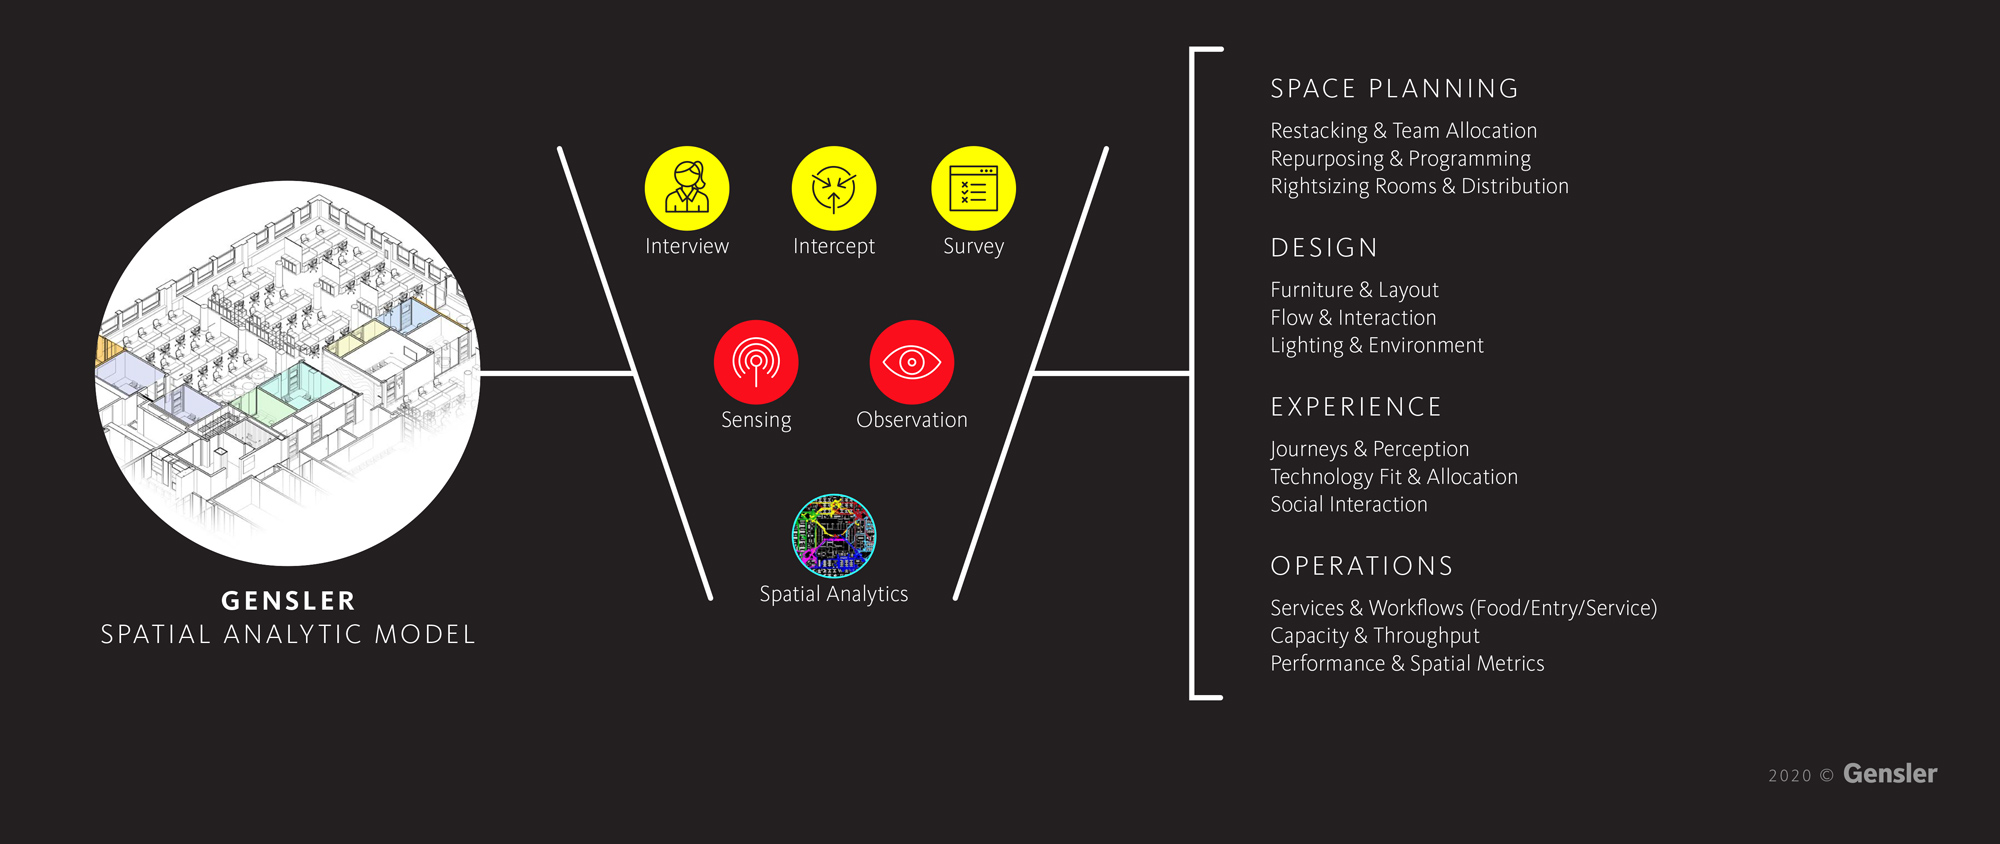
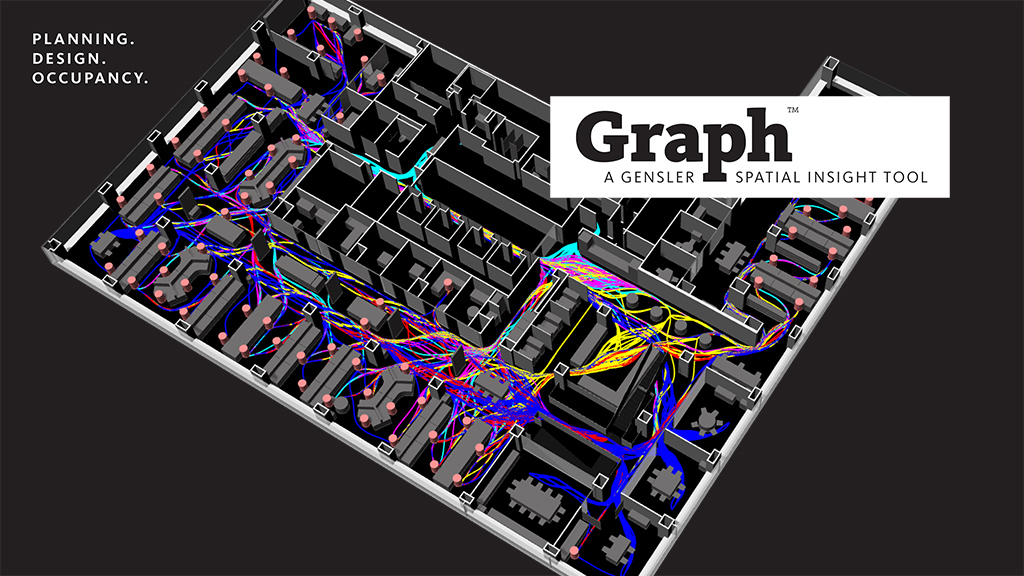
Graph is a suite of products built on top of Gensler’s Spatial Analytic Model. The Spatial Analytic Model integrates multiple forms of data, runs comprehensive computational analysis, and visualizes the results in a simple and easy-to-understand way. We can now make the invisible visible to drive planning, design, and operational decision-making.
Currently, we can integrate qualitative data about the human spatial experience (such as interviews, Experience Index, and NPS scores) with quantitative data about observed human behavior (from building sensors, WiFi location tracking, badging, or other sources), and with spatial analytics on the design, layout, or configuration of a space. This provides us with powerful evidence as a basis for design strategy and decision making with our clients.
The Graph toolkit supports a suite of powerful tools that quickly and efficiently deliver spatial insights at scale to determine highest and best use of space. Gensler sees how vital it is to give clients a new tool to make real estate and design decisions and to help them improve the performance of their design investments.
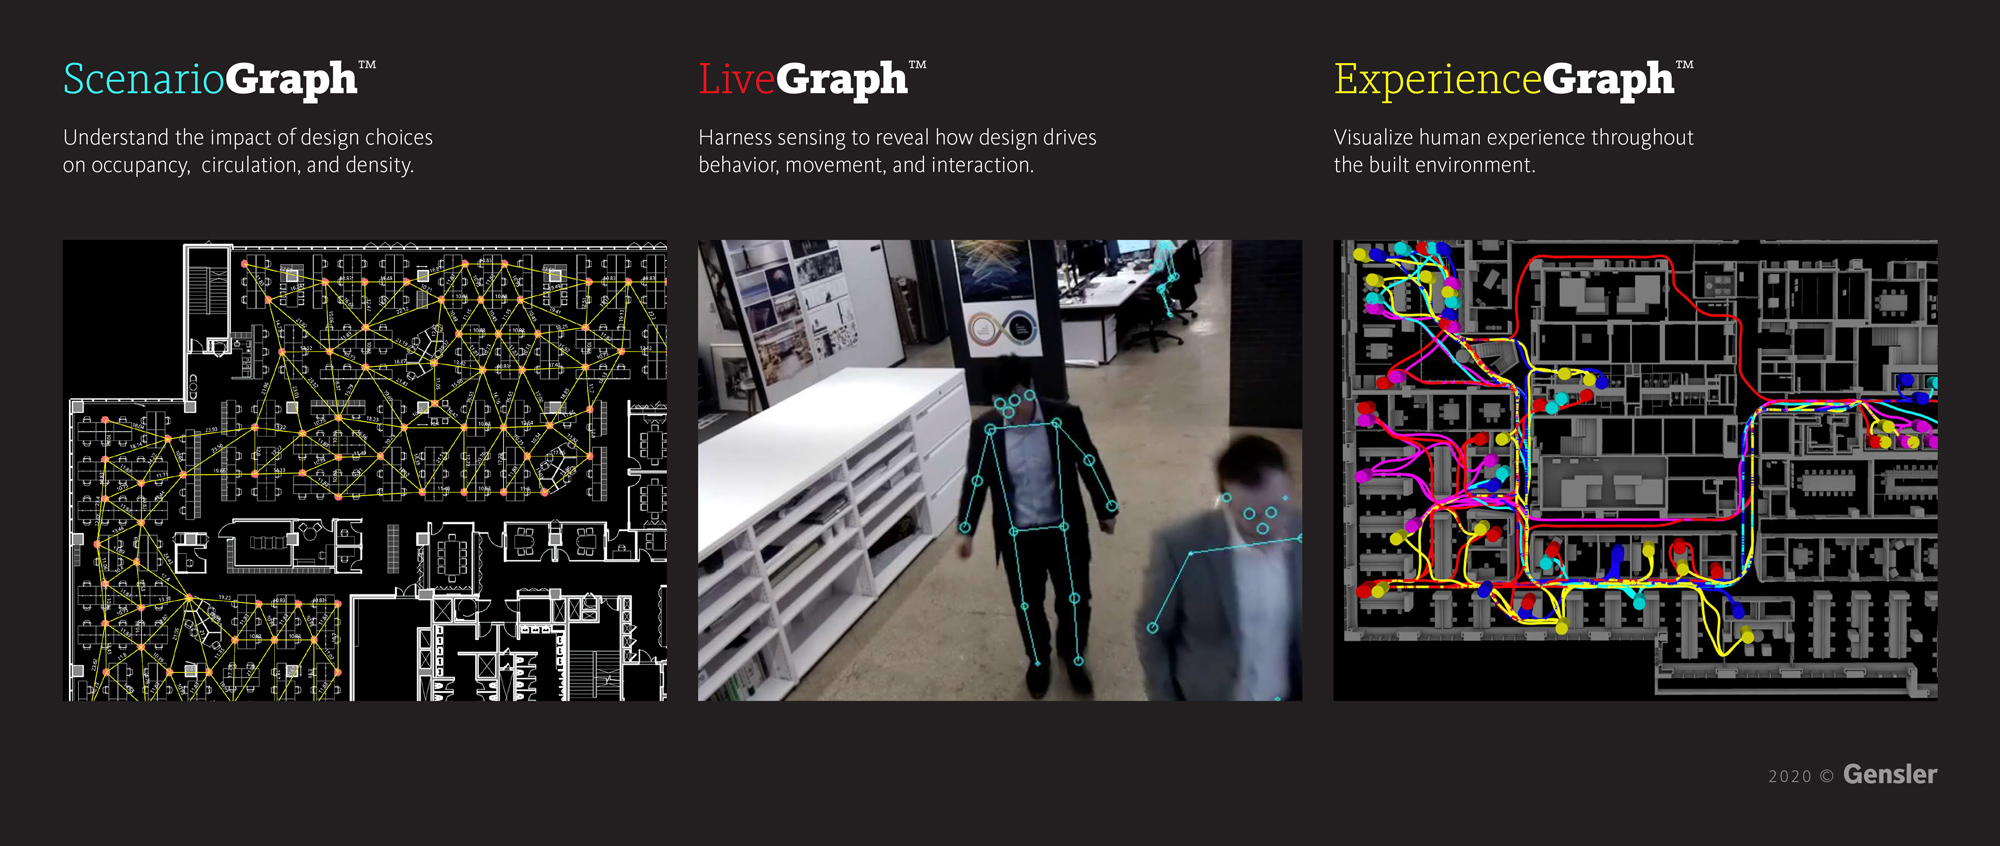
Graph is currently made-up of three analytic tools:
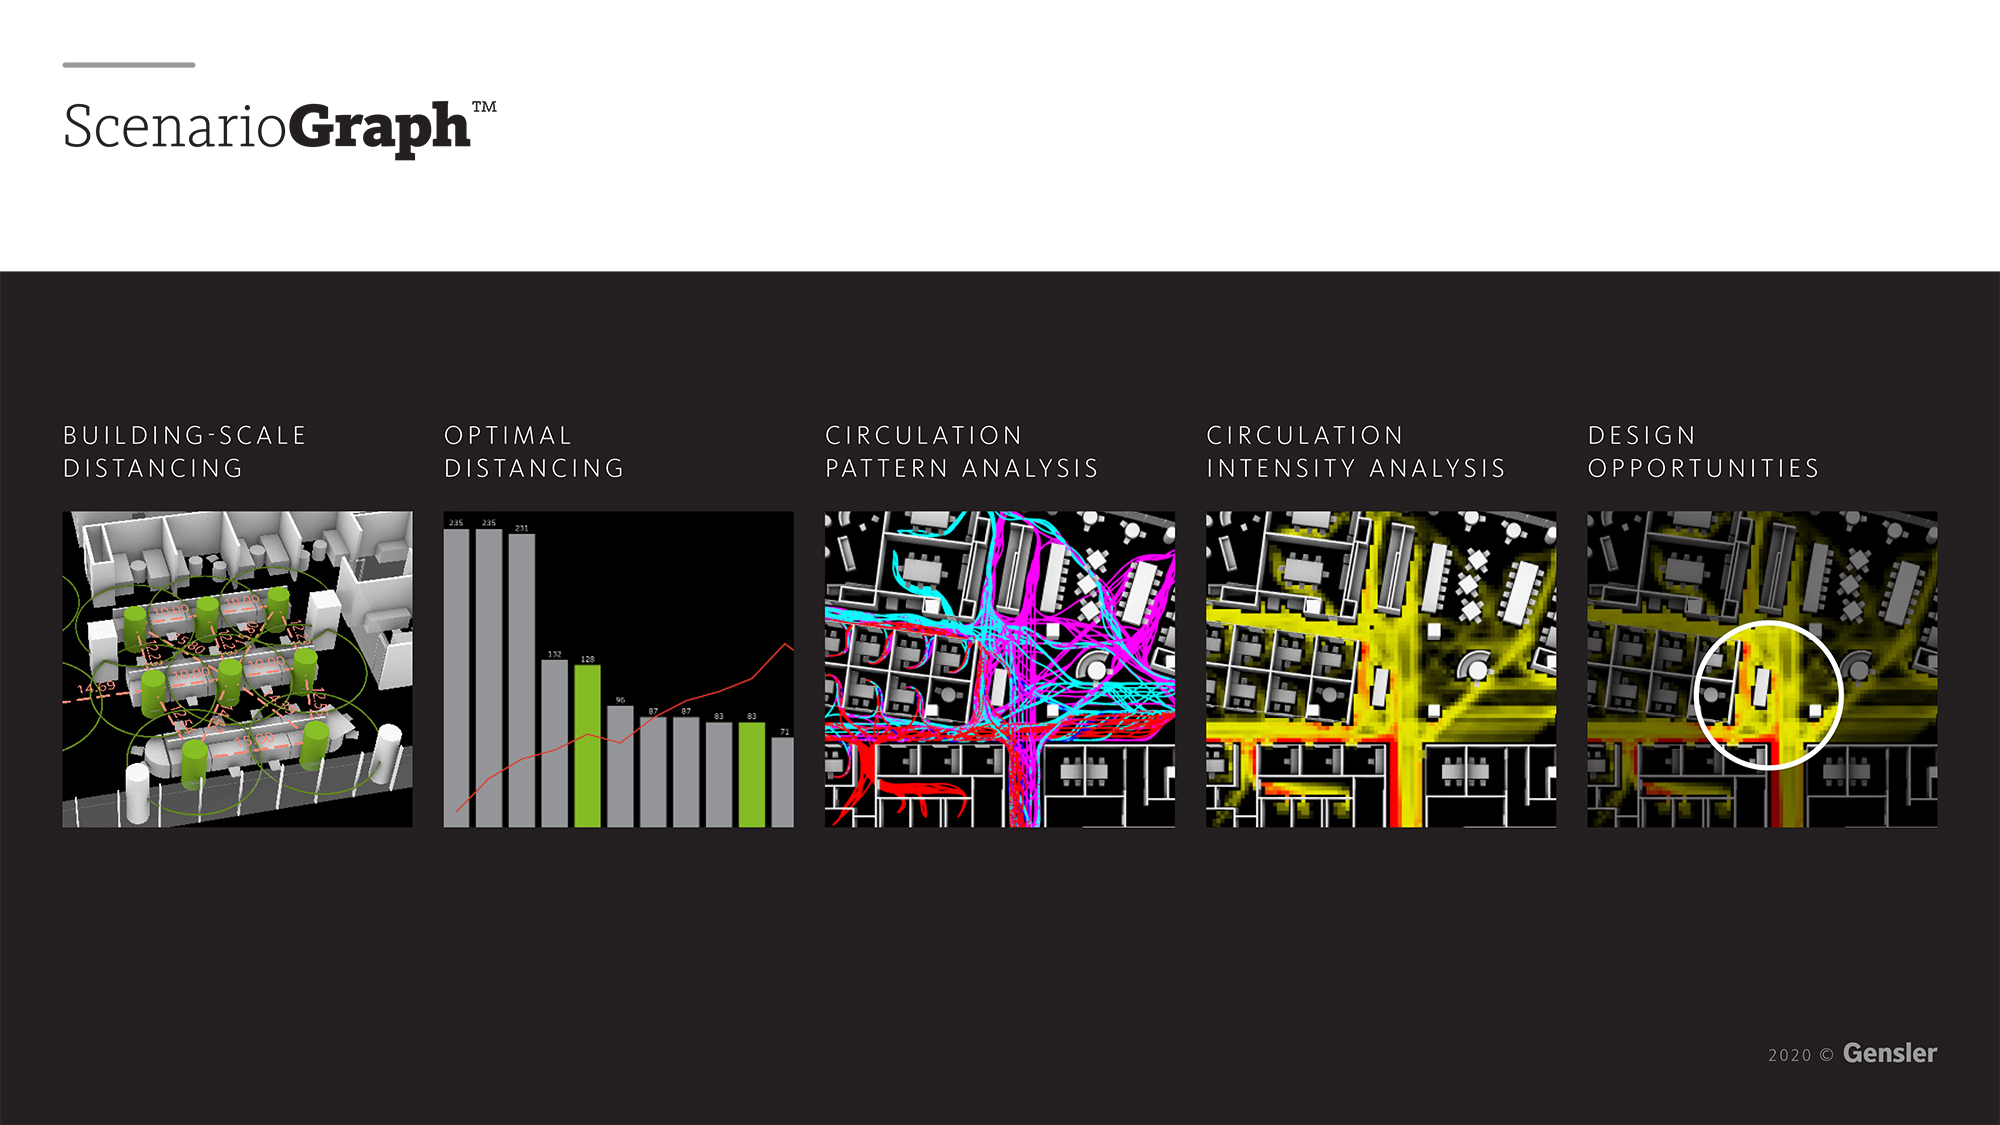
ScenarioGraph™ is a spatial scenario planning tool that allows us to understand the impact of design choices on occupancy, circulation, and density. It models capacity and helps inform space planning and workflow on a floor, throughout the building, on a campus, or across a portfolio.
For our workplace clients, we have optimized ScenarioGraph for re-entry planning. We can ingest floor plans in any format to create a computable spatial model. To support portfolio decisions about occupancy, flexible use, department return sequencing, and distancing, we are computing optimal seating distributions from three feet to 20 to generate yield curves for a floor or stack. We then also compute probable circulation, and circulation intensity at different levels of occupancy to better visualize how programming, policy, and movement impact things like the likelihood of collision or interaction. We can also inform how design can support different kinds of capacity or which spaces are already fit for re-occupancy based on client guidelines. We recently used ScenarioGraph to design for our own re-occupancy.
ExperienceGraph™ maps and visualizes human sentiment and overall experience throughout the built environment. The ExperienceGraph toolkit spatializes survey data, journey data, or intercept data to map a clear picture of experiences in space — and the spatial factors that matter to any experience.
We have been integrating ExperienceGraph and ScenarioGraph for our retail and mixed-use clients for the past year to reveal patterns of use and then mapping where various segments of users have positive and negative experiences. With ExperienceGraph, Gensler can help anyone with a large campus or site better identify design and operational decisions that can drive results in experience scores and sales.
LiveGraph™ allows us to spatially model sensing, transaction, or other time-series data to reveal how design drives behavior, movement, and interaction. We have used LiveGraph and the Gensler Spatial Analytic Model to create an analytic digital twin of our own office, and to integrate sensor data from multiple sources, including infrared and computer vision, to advance our ability to study and learn from our own spatial behaviors.
The beauty of a computable spatial model is that once you have built it, you can run analyses continuously to learn how patterns of use and engagement change. Graph is designed for continuous, granular insight that drives better design and operational decisions.
We are using the Graph toolkit to advance occupancy strategy, circulation, layout, space planning, and future scenario planning for COVID-19 re-occupancy on millions of square feet. With the ability to easily import and export from CAFM systems, Graph conducts tailored analyses that help teams better manage and plan for re-occupancy across large portfolios — and think through the implications of remote work, timed-entry, departmental occupancy, circulation impact, or other strategies. While this is top of mind for workplace clients, these considerations are equally important across retail, education, healthcare, and entertainment.
Ultimately, data alone is insufficient to drive outcomes in the built environment. Too much data can be stifling. By integrating multiple forms of data with a tool expressly developed to frame design choices, we can enter a new era of evidence-based design. Gensler’s Graph product suite supports clients who need better information to make changes and invest in the future — which, today, is everyone.
For media inquiries, email .